RSI Supply & Demand Zones: How to Trade and Automate RSI S&D
Using the RSI Indicator to define Supply & Demand zones allows us to focus on market sentiment before structure becomes obvious.
Why Supply & Demand RSI Zones Matter in Automated Trading
Within Supply & Demand trading, price zones represent some of the clearest footprints of market imbalance and participation by large market players. These zones are not indicators, patterns, or subjective retail concepts — they are areas on the chart where supply or demand has clearly overwhelmed the opposite side, causing price to move away with strength.
Reac the basic and full Supply & Demand zones explanation for an introduction to Supply & Demand zones.
Using RSI to Define Supply & Demand Zones Through Sentiment Shifts
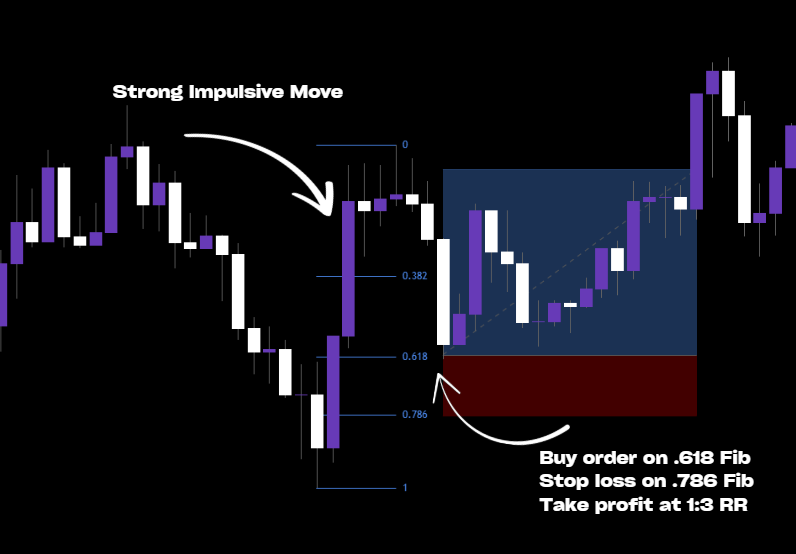
Traditional Supply & Demand trading relies on visible price action — impulsive moves, breakouts, and structural shifts — to identify areas where supply or demand entered the market. While effective, this approach reacts after price has already revealed its hand.
An alternative approach is to focus on market sentiment before structure becomes obvious.
By using the Relative Strength Index (RSI) as a sentiment filter, we can identify moments where price becomes overextended, and then objectively confirm when control shifts from sellers to buyers. This allows us to define new Demand zones based not only on price behavior, but on internal market pressure.
This method is particularly powerful in automated trading, where objective thresholds and confirmation rules can be enforced consistently.
Since we focus on building automated trading systems for MetaTrader 5, we will refer to these systems as Expert Advisors (EAs) going forward. We’re also specifically focusing on Demand zones in this article.
What is a Supply/Demand RSI Zone
Supply & Demand RSI zone is a price area where market sentiment has shifted, identified by an overextended move measured through the RSI and confirmed by strong price action. Instead of relying solely on visible breakouts or trend changes, this approach uses the RSI to detect exhaustion in the prevailing trend before a new Demand or Supply zone is formed.
In the case of a Demand RSI zone, the market first shows sustained downside pressure, with RSI remaining below a defined threshold. This overextension is then invalidated by strong bullish price action, signaling a shift in control from sellers to buyers. The zone is drawn from the first impulsive imbalance candle following this shift.
A Supply & Demand RSI zone, therefore, represents the transition point between sentiment exhaustion and renewed directional intent, making it a structurally and statistically defined area of interest rather than a subjective drawing.
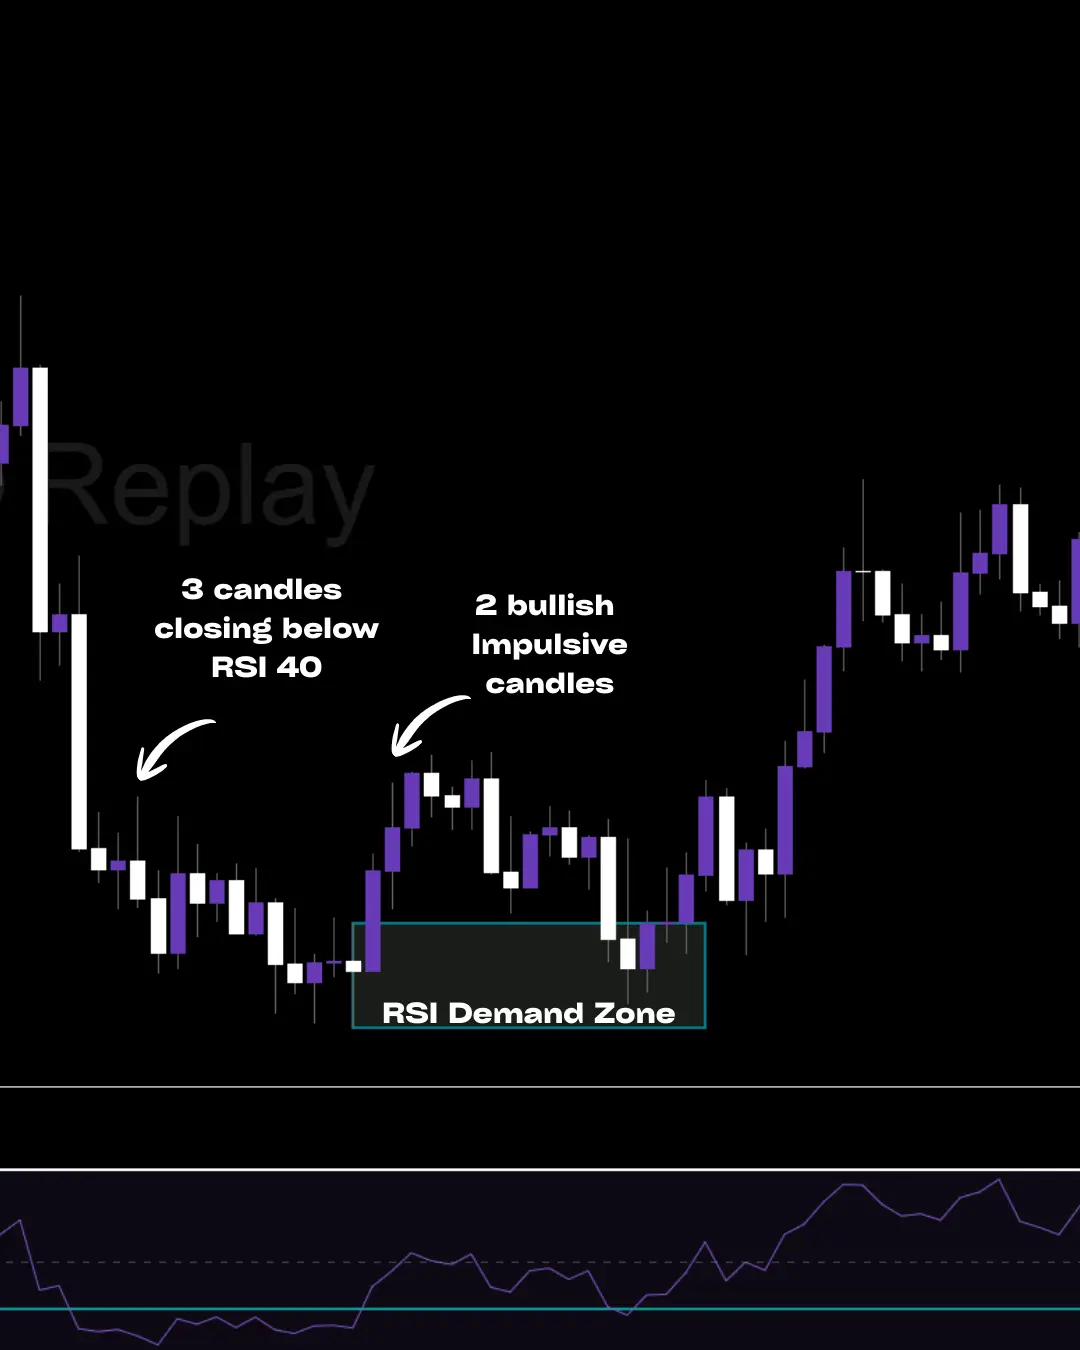
Structurally, a Demand RSI zone is identified by:
- 3 consecutive candles showing a <40 RSI
- Identify a bullish trend shift with 2 bullish engulfing impulse candles
- The last imbalance candle before the bullish trend shift is the base of the zone
These characteristics make this iteration of Demand zones objective zones of interest rather than subjective trade entries.
Automating Supply & Demand RSI Zones Using Profectus AI
With Profectus, traders can transform the Supply & Demand RSI zones concept into a fully automated module without writing code.
Using Profectus, you can:
- Detect Supply & Demand RSI zones mechanically
- Monitor breaks of zones and creation of new zones
- Use the Supply/Demand RSI zone as an area to take a trade from
- Apply consistent execution rules
This no-code trading approach allows traders to experiment, refine, and deploy institutional concepts in minutes.
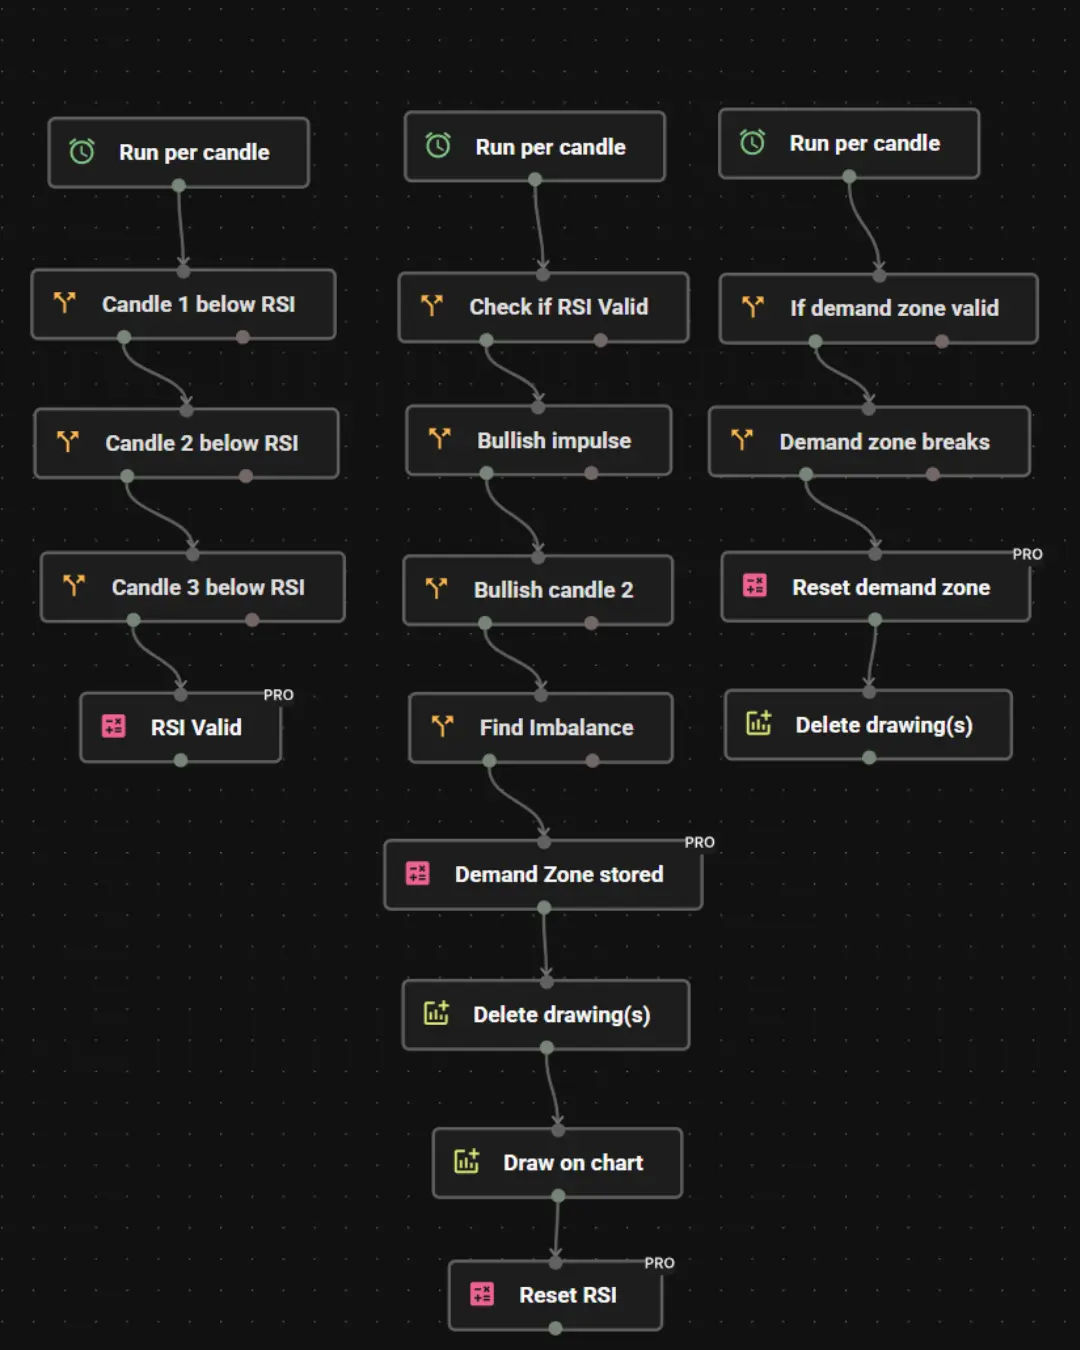
I named the blocks to make it easier for you to understand what we’re doing in each Profectus block. This concept is only slightly more advanced than standard S&D zones, but it’s a very interesting concept to test for yourself. We can divide the creation of this no-code EA for Demand RSI zones into 3 steps.
- Identifying the bearish overextension. Using the Run per candle block, we first look to see if we have an overextension of the bearish trend by identifying 3 consecutive candles with RSI values below the threshold (<40 in this case).
- Defining a bullish trend shift. If there is bearish overextension, we will look for a shift in trend by spotting 2 bullish engulfing candles. Bullish CID 1 needs to close above the highs of CID 2 and CID 3 to confirm an impulsive move.
Store & Reset the Demand RSI zone price levels. Once the criteria from step 2 have been met, the demand zone is stored on the imbalance candle before the bullish trend shift. Now the EA remembers where this demand zone is located, and it can reset the zone once the bullish trend is no longer in place.
And that’s it! It only takes a few minutes to drag-and-drop the blocks and build this Demand RSI zone module in Profectus. You can now add an execution module to start taking trades, or add more rules to refine the Demand RSI zone, or add more confluences to the strategy.
Get Access to the Demand RSI Zone Automation Template
Want to see how this Demand zone concept works when fully automated?
Access an enhanced automation template used to turn this trading concept into a deployable MQ5 trading bot inside Profectus. This template has a trade execution module included, so you can start testing it right away!
Disclaimer: Templates are for educational purposes only!
👉 Get the Demand EMA Zone Automation Template → Demand RSI Zone Profectus Template
Other related blog posts
Dive into a world of knowledge, trends, and industry updates on the Variable blog. Our curated content covers a spectrum of topics.