Analyze Backtest Reports with the Profectus Report Analyzer
Learn which backtest metrics matter most with the Profectus Report Analyzer
Profectus Report Analyzer
An MT5 backtest report can look very impressive, as if you’ve just created a holy-grail strategy. The equity curve slopes upward steadily, the net profit figure is impressive, and the strike rate is well above 50%. This seems to be an amazing algorithm…right?
A profitable backtest doesn’t automatically mean that your algorithm is robust. Before an algorithm can be considered good enough for trading real money, it needs to be judged through the right metrics.
That is exactly why we built the Profectus Report Analyzer. Instead of relying only on the standard MetaTrader 5 report, the analyzer turns an MT5 backtest into a cleaner performance dashboard with risk metrics. These most important metrics include, but are not limited to:
- Profit factor
- MAR ratio
- Equity Drawdown
- Prop Firm metrics
- Days underwater
- Monte Carlo analyses
The goal is simple: help traders make better decisions based on data instead of emotion.
If you want to learn more about the Profectus Report Analyzer before learning about the best practices, read our full guide here.
You can also watch the Youtube video on our Profectus Report Analyzer: Video Report Analyzer
Why Backtest Analysis Needs More Than One Number
When viewing a backtest report, you are most likely first looking at the most obvious figures: net profit, win rate, and maybe maximum drawdown. Those numbers matter, but they can’t paint a full picture.
A strategy can have a high win rate (>50%) and still lose money if the losses are larger than the wins. Another strategy can have a low win rate (<50%) and can still be incredibly profitable if the wins are much larger than the losses. A strategy can show strong net profit because it was tested with a large risk per trade, but that does not tell you whether the return was worth the risk.
Good backtest analysis is about context. The real question to ask is:
“Did this strategy produce enough return for the amount of risk, time, drawdown, and uncertainty involved?”
That is the mindset behind the Profectus Report Analyzer. It helps you to have a much better understanding of the performance of your algorithm, more so by looking at the risks than by only looking at the profits.
Let’s dive into our favourite metrics for analyzing MT5 backtest reports.
Acces the Profectus Report Analyzer
Trade Count: Is There Enough Data?
Before we look at advanced performance metrics, we first want to know whether the backtest has enough data to be taken seriously. We call this a significant data sample. An algorithm that performs well over 2 months of data cannot be considered statistically significant and is thus unreliable.
As a rule of thumb, we prefer to see at least five years of backtest history when the market and instrument allow it. This gives the strategy more chances to experience different conditions: trending markets, ranging markets, high-volatility periods, low-volatility periods, and losing streaks.
Trade count matters as well. A strategy with only a small number of trades is extremely sensitive to randomness. One or two unusually good trades can distort the entire report. A larger trade sample does not guarantee the strategy is good, but it does make the statistics more meaningful.
When analyzing a report in Profectus, first look at the period covered by the backtest and the total number of trades. If the backtest is too short or the number of trades is too small, we should already be warned.
Strike Rate
Strike rate, also called win rate, is one of the most popular metrics because it is easy to understand. It shows the percentage of trades that closed in profit. The problem is that it doesn’t show anything about how big those winning trades are and how big the losers are.
Let me give you 2 examples to clarify this further.
Example 1: 60% Strike rate with 1:1 risk-to-reward
Assume you risk $100 per trade. A winning trade results in a $100 profit, and a losing trade results in a $100 loss.
- 100 trades
- 60 winners = 60 × $100 = +$6,000
- 40 losers = 40 × $100 = -$4,000
Result: +$2,000
Example 2: 35% strike rate with 1:4 risk-to-reward
Again, assume you risk $100 per trade. A winning trade results in a $400 profit, and a losing trade results in a $100 loss.
- 100 trades
- 35 winners = 35 × $400 = +$14,000
- 65 losers = 65 × $100 = -$6,500
Result: +$7,500
A 60% strike rate sounds attractive, but it says nothing about how large your winners and losers are. On the other side, a strategy with a 35% strike rate can be highly profitable when the winners are large enough to compensate for the losses.
This is why we do not judge a strategy by strike rate alone. We use it as a supporting metric. It tells us something about the nature of the system, but it does not tell us whether the system has a profitable edge by itself.
MAR Ratio: Yearly Return vs Maximum Drawdown
One of our favourite metrics for judging backtest quality is the MAR ratio. MAR compares the strategy’s annualized return to its maximum drawdown. In practical terms, it answers a simple question:
“How long does it take to recover from the maximum drawdown?”
A MAR ratio around 1 is already strong. An MAR of 1 means the average annual return is roughly equal to the maximum drawdown. In simple terms, if the strategy hits its historical maximum drawdown, the average annual return suggests it could take about one year to recover, assuming similar performance continues.
Any MAR ratio above 1 is very good. If you find an MAR of 2, it means that your maximum drawdown, if it is reached, could be recovered fully in around 6 months. Of course, this is not a guarantee. It is simply a useful way to compare return and drawdown in one number.
When we review strategies, MAR is one of the first ratios we look at after confirming the backtest duration and trade count. It quickly tells us whether the return profile is impressive because of genuine efficiency or simply because the system took too much risk.
Equity Drawdown: When to Stop Trading
Maximum equity drawdown is one of the most important risk metrics in any backtest. It shows the deepest percentage decline from a previous equity peak. In other words, it shows how much you could have lost over a given period of time before recovery set in.
We use Equity Drawdown as a data-based threshold for when a strategy should be turned off. The logic is simple. If a strategy had a maximum historical equity drawdown of 20%, we add a margin of error. A practical approach is to add 10% of the drawdown figure as a buffer. In this example, 10% of 20% is 2%, so the strategy threshold becomes 22%.
If the live strategy later breaches that 22% threshold, it is entering new territory compared to the backtest. That does not automatically mean the strategy is permanently broken, but it does mean the strategy is now producing new information. At that point, continuing trading with this strategy becomes guessing.
We are not in the business of hoping a system recovers just because we like it. We want data-based decision rules. A drawdown threshold gives us a predefined line where we pause and reassess a strategy.
FTMO Phase 1 Pass Rate: Suitable for Prop Firms?
This metric estimates how likely the system would be to pass Phase 1 of an FTMO-style challenge based on the historical trade data. That means reaching a 10% profit target before reaching the 10% maximum drawdown threshold.
This metric does not tell you how long it will take to pass. Instead, it asks a more specific question:
“if you turned on this strategy at a random point in the backtest, how likely would it be to reach the required profit target before violating the drawdown limits?”
The FTMO Phase 1 metric is especially useful for traders who want to use automated strategies in a funded-trader environment. A good strategy is not automatically a good challenge strategy.
Days Underwater: How Long Until You Recover
Days underwater measures the longest period during which the strategy stayed below a previous equity high. This is sometimes called the stagnation period.
A strategy can have an acceptable maximum drawdown but can still be difficult to trade if it spends a long time without making new equity highs. For example, a strategy that goes 600 days underwater may test a trader’s patience, even if the final net profit looks strong. That means it can be almost 2 years where you don’t make any money on this strategy (in terms of net profit above the previous equity high).
Even if you are an algorithmic trader, the psychological stress of being underwater for such a long period of time can be overwhelming. The metric sets realistic expectations about drawdown periods.
Monte Carlo Simulation: Testing Alternative Scenarios
The Monte Carlo simulation is one of the most powerful parts of the Profectus Report Analyzer. Instead of only showing the exact historical trade sequence, the analyzer generates thousands of alternative scenarios based on the strategy’s trade results.
The Monte Carlo engine reshuffles trades to create 5,000 different outcomes. For each scenario, it measures key outcomes such as net profit and maximum drawdown. This gives a better view of what could have happened if the same strategy experienced a different order of wins and losses.
The Monte Carlo simulation is most useful to determine if a strategy is heavily optimized. If the Monte Carlo confidence intervals show drawdown and net profit results that are much worse than the sample backtest results, chances are that the strategy is over-optimized and not robust.
If the Monte Carlo results are similar to the original backtest, that gives more confidence that the system is not overly dependent on one lucky sequence.
There are limitations. A Monte Carlo simulation does not perfectly preserve strategy logic. By shuffling trades, it can create scenarios where a long and short trade appear at the same time, even if the actual strategy would never allow that.
Portfolio Analytics: The Power of Combining Strategies
One of the most useful features of the Profectus Report Analyzer is portfolio mode. Instead of analyzing one MT5 report at a time, portfolio mode lets you combine multiple reports into a single analysis. This is where backtest analysis becomes much more realistic for traders running more than one system.
The goal of a portfolio is not simply to add more strategies. The goal is to improve the overall return profile without increasing risk in the same proportion. A good portfolio can smooth the equity curve, reduce combined drawdown, and make performance less dependent on one strategy type or market condition.
Portfolio mode shows whether the combination of strategies actually improves the result, or if you are better off only trading one or some of the strategies by themselves.
Let’s build a portfolio of 2 strategies and see if we can improve our performance.
.webp)
These are 2 reports, from 2 different strategies. I have highlighted a few metrics from each and I’ll write them out here for if they are difficult to read.
Report 1 (left)
Maximum Drawdown: 12.72%
MAR Ratio: 0.32
Days Underwater: 857
Net Profit: 34.4%
Report 2 (right)
Maximum Drawdown: 11.74%
MAR Ratio: 0.45
Days Underwater: 406
Net Profit: 65.7%
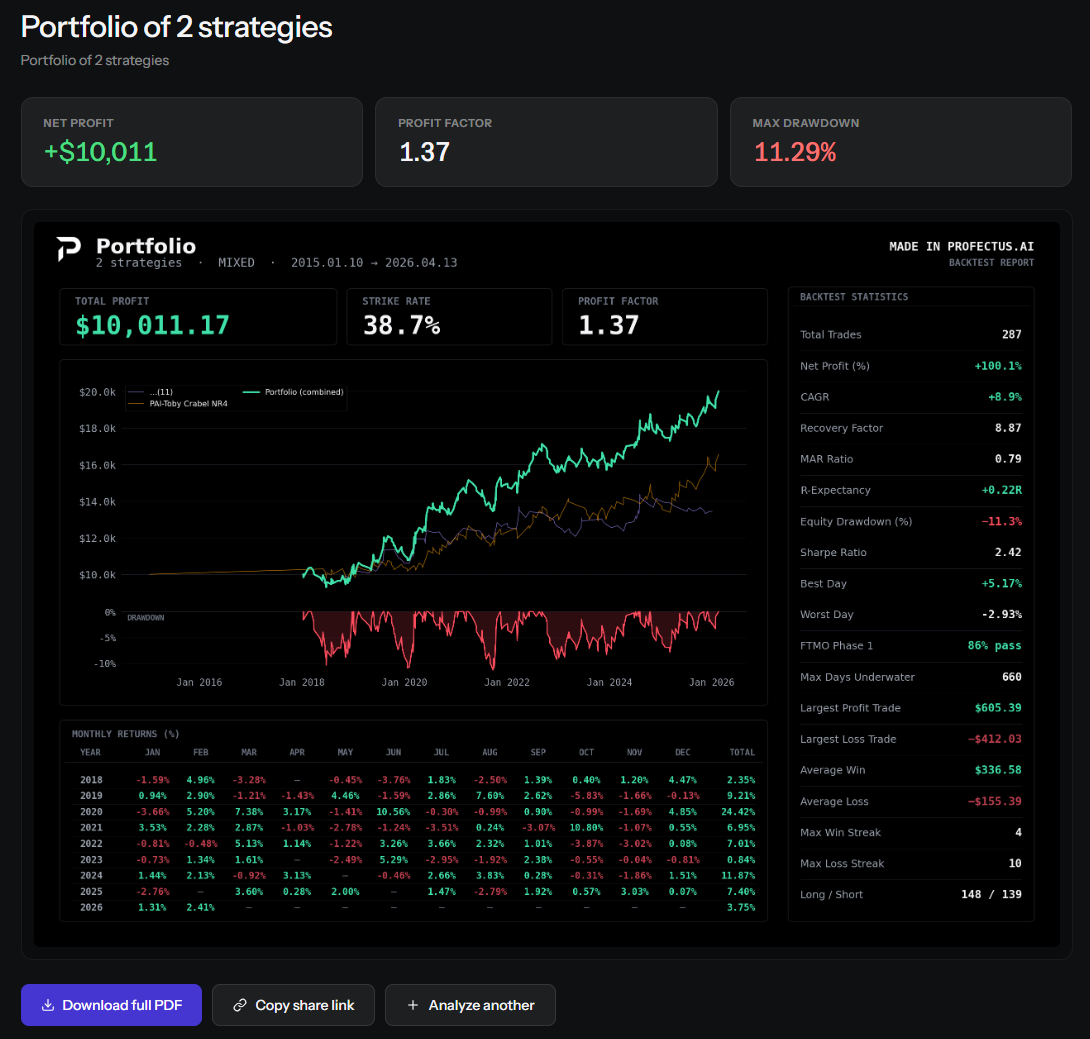
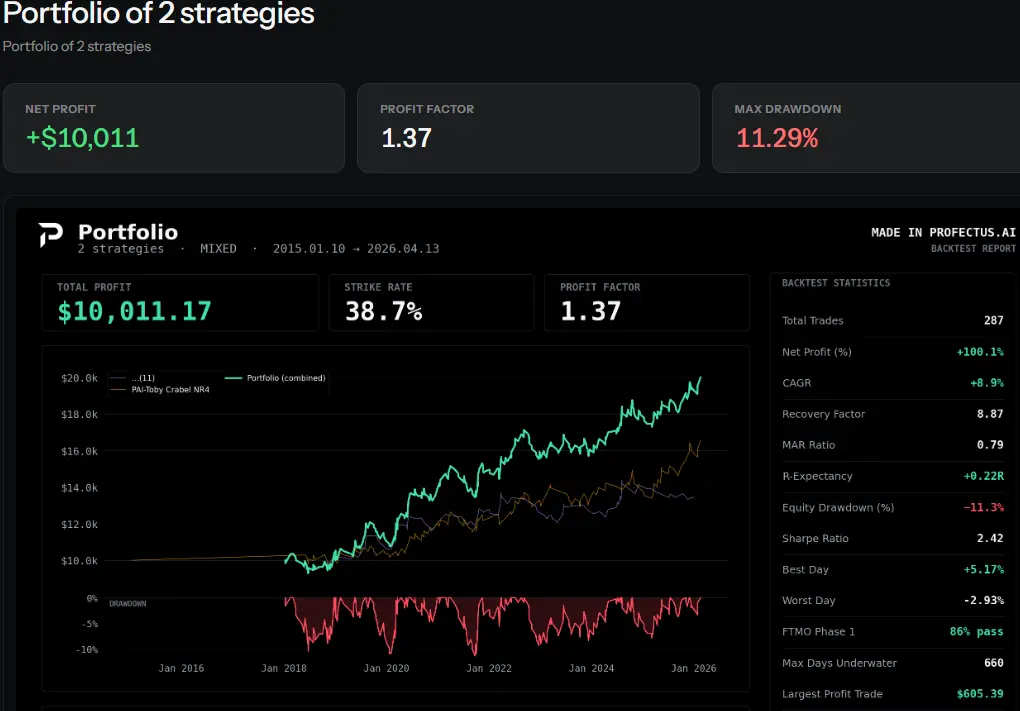
I have now combined these 2 strategy backtest reports in the Profectus Report Analyzer to create a portfolio. This is the portfolio analytics report of the 2 strategies combined.
Let’s go over the same set of metrics again.
Portfolio
Maximum Drawdown: 11.29%
MAR Ratio: 0.79
Days Underwater: 660
Net Profit: 100.1%
We can already spot a few great improvements.
- The combined net profit reached 100.1%, as this is simply the sum of the 2 net profits of both reports combined. However, the Maximum Drawdown reached only 11.29%. This is lower than both the individual reports, while reaching the maximum combined net profit. This already shows there is great diversification between the two strategies
- The MAR ratio grew to 0.79. This is a massive improvement. This is due to the fact that the strategies seem to hedge one another perfectly. If one strategy is experiencing a drawdown period, the other strategy seems to be covering these losses with profits to lower the overall drawdown.
- Maximum Days Underwater also shows how the strategies seem to be hedging each other. It would be worse if this number were bigger than the biggest number of the 2 reports.
This example shows how combining strategies into a portfolio using the Profectus Report Analyzer can greatly improve your trading performance. However, it’s not always the case that the metrics improve. If strategies are too much alike, you are simply increasing your risk for the same increment in profits. That is no improvement.
Conclusion: Better Backtest Analysis Leads to Better Trading
The Profectus Report Analyzer helps traders look beyond the surface-level numbers and focus on the metrics that actually matter:
- Risk-adjusted return
- Drawdown behavior
- Monte Carlo Robustness
- Prop Firm suitability
- Portfolio Improvement
As a good trader, you ask whether the strategy made money in a way that can realistically be traded, managed, and trusted when conditions change. That is the real value of better backtest analysis.
If you want to learn more about the Profectus Report Analyzer, read our full guide here.
Other related blog posts
Dive into a world of knowledge, trends, and industry updates on the Variable blog. Our curated content covers a spectrum of topics.
.png)