Fibonacci Retracement Strategy Automated
Turning the popular Fibonacci Retracements tool into a fully automated strategy is easy with Profectus AI
.png)
Fibonacci Retracement Automated
The Fibonacci indicator is one of the most well-known indicators in the trading space. Originally, it was a mathematical tool used to calculate ratios between values. The 1.618 ratio is known as the “Golden ratio”. Interestingly, the Fibonacci ratios can be seen in natural structures, such as shells and flowers.
The Fibonacci ratios hold a lot of value in the trading community because they help to quantify levels of support and resistance in a mathematical way. The ratios have been simplified and are now used in the Fibonacci indicator to show areas of interest between 2 levels. The most commonly used method is to identify a move (from low to high, for example), and calculate the Fibonacci ratios for this move. The ratios represent a percentage of the move. For instance, the .618 Fibonacci ratio represents the price level found at 61.8% measured from the high of the move. The .50 Fibonacci ratio represents the price level at 50% measured from the high of the move, the exact middle.
Disclaimer: Templates are for educational purposes only!
👉 Get the Fibonacci Retracement Automation Template → Fibonacci Retracement Profectus Template
This template is designed to run on the Daily Timeframe.
You might also want to watch the full YouTube video on the Fibonacci Retracement strategy here to get an in-depth explanation of the pattern.
Using Fibonacci in Trading
Traders use Fibonacci ratios to identify levels to which price might pull back and react from again after price has made a clear move. They are quantified levels of support and resistance. The .618 Fibonacci retracement level is one of the most important levels in the sequence, and regardless of the structure of the move you are measuring, it can work very well to look at this area for potential continuation trades.
The .618 retracement level means that the move needs to pullback for 61.8%. This offers an attractive risk-to-reward play if you can get in at this level, although it might have a lower chance of succeeding because it could be argued that the move has died down if it pulls back this far.
The goal of the Fibonacci retracement is to turn a popular trading concept into a structured, testable, and automated strategy.
The Daily Fibonacci Strategy
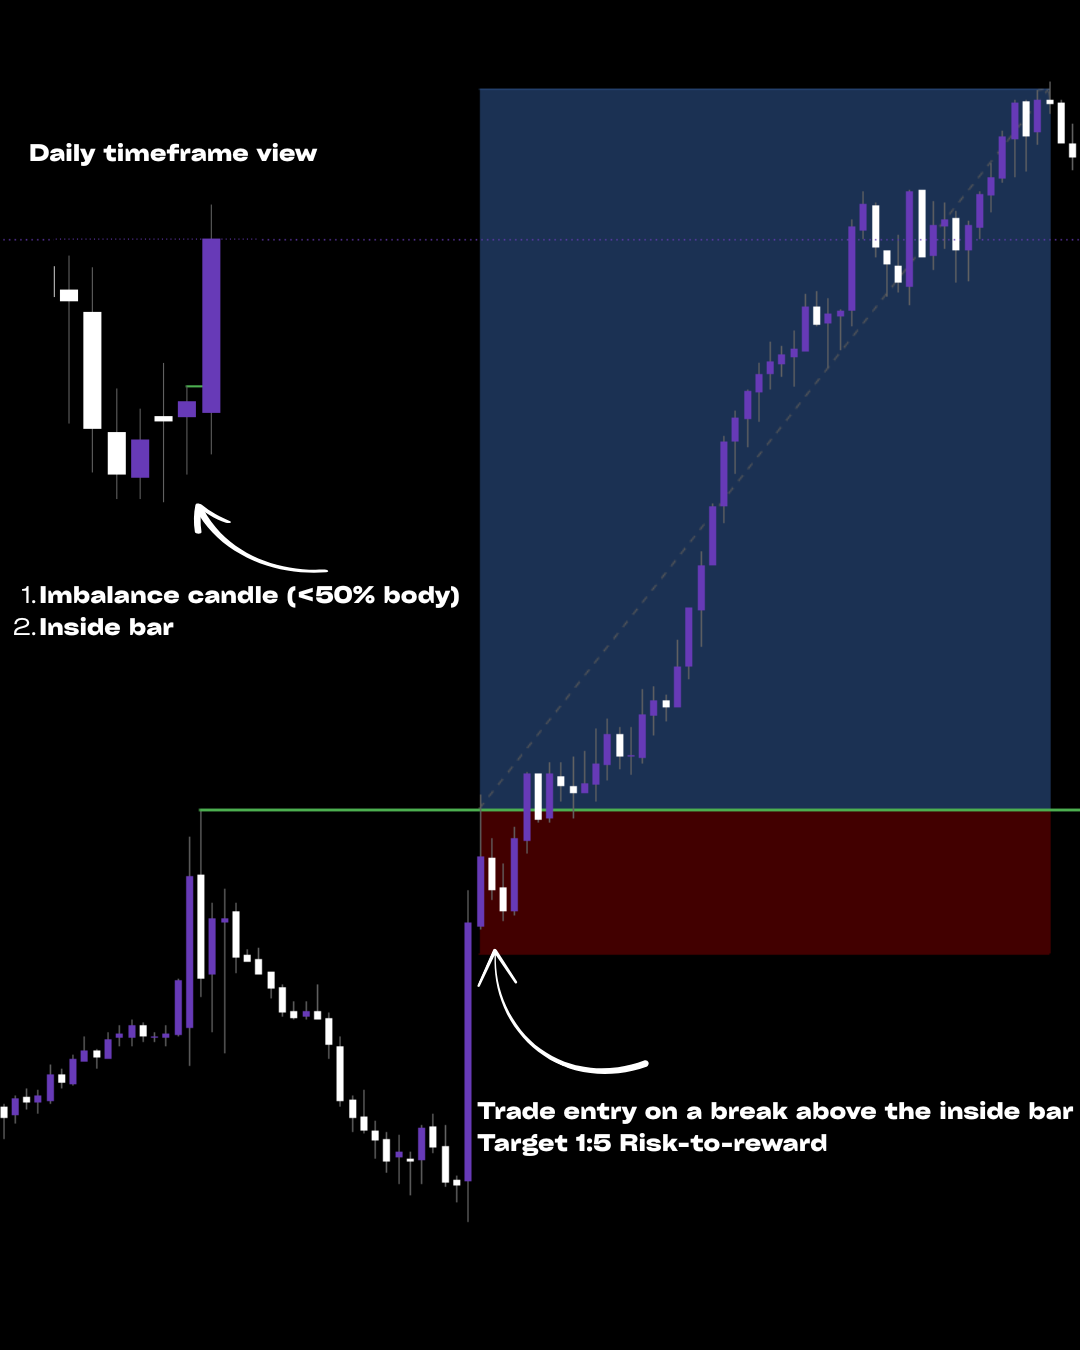
We have developed an incredibly simple and purely mechanical strategy that incorporates the Fibonacci tool to spot continuation trades. Most traders talk about using the Fibonacci ratio with a swing high and swing low move. This is incredibly vague and is hard to quantify. What we have done for this strategy is to simply take a daily candlestick, of which the body is greater than 70% of the entire candle size, and take this as our swing move. The thinking is simple: on the lower timeframes, such a strong daily candle clearly shows as a swing move.
The exact rules for the strategy are the following:
- Look if the previous Daily candle has a body that is greater than 70% of the entire candle size
- Check if the big-bodied candle is bullish or bearish
- Calculate the distance from the candle high to the candle low
- Calculate the .618 Fibonacci level by taking the level at 61.8% of the distance from high to low
- If the candle is bullish, place a buy pending order at the .618 level with a stop loss on the candle low and a take profit at 500% of the stop loss.
If the candle is bearish, place a sell pending order at the .618 level with a stop loss on the candle high and a take profit at 500% of the stop loss.
This is an example of a buy trade from a bullish candle setup.
You can see that this strategy is fully mechanical and thus can be automated easily in Profectus AI. The beauty of the strategy is that it captures continuation trades, trying to get in at the best possible value.
Automating the Fibonacci Retracement Strategy
Now that we’ve explained the rules and shown you what a trade setup looks like, let’s automate it together in Profectus AI.
It’s one of the easier strategies to automate and requires only a few blocks.
Disclaimer: Templates are for educational purposes only!
👉 Get the Fibonacci Retracement Automation Template → Fibonacci Retracement Profectus Template
This template is designed to run on the Daily Timeframe
- Initiate the variables. We start by putting the following variables in the Variables list. All are numbers and have a value of 0 by default:
High
Low
Highlow
Highlowfib
Fib
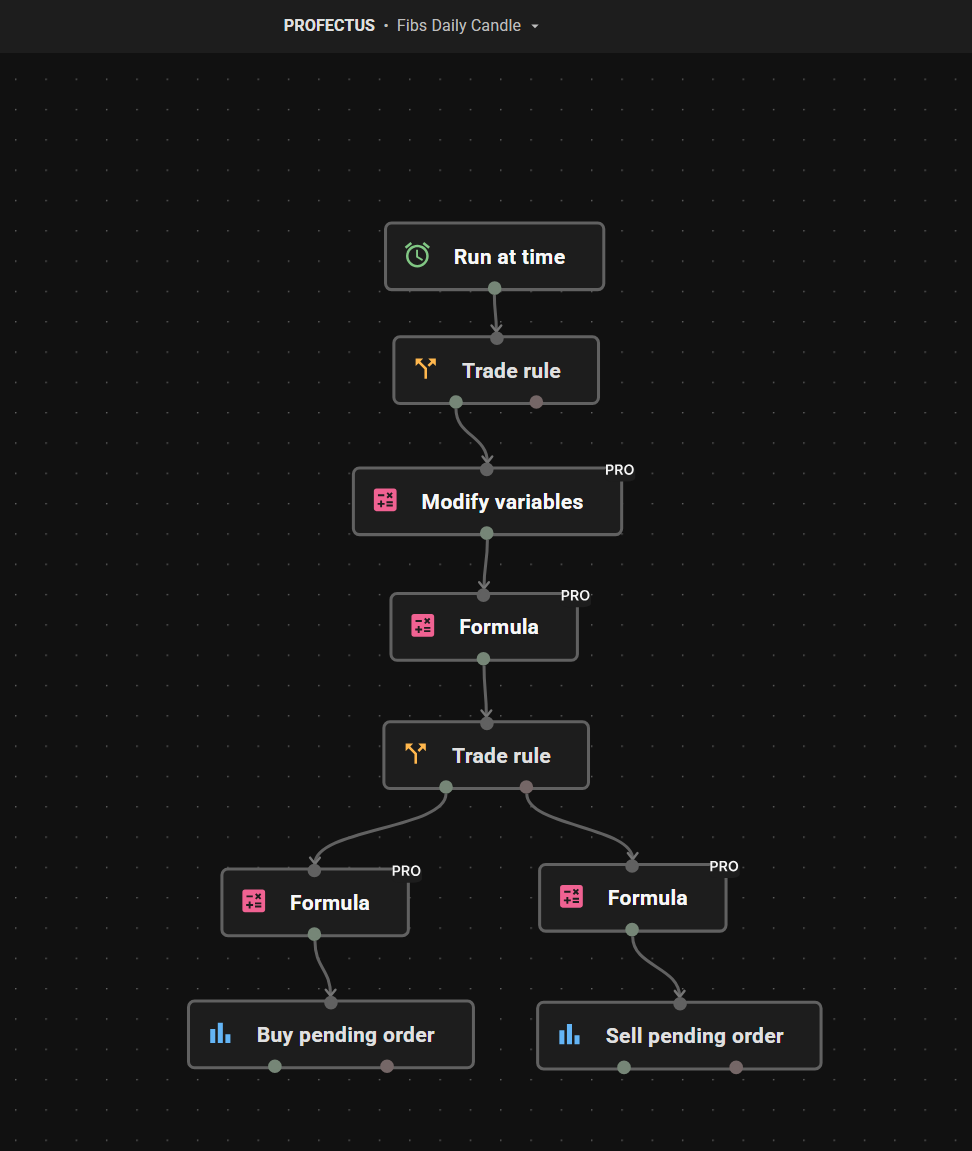
- Run at time. Start the EA with a Run at time block and put the time at 02:00 to initiate the system just after market open every night
- Trade rule for checking the big body. Put a trade rule block with the following rules.
Candle body size, Candle ID 1 => Candle total size, Candle ID 1 *0.70
In this block we check if the body size of the previous candle is bigger than 70% of the total candle size
- Modify variables. In this modify variables block we assign the variable highto the candle high of candle ID 1 and the variable low to the candle low of candle ID 1
- Formula. Here we do the calculations to find the .618 Fibonacci retracement level. There are 2 calculations:
Highlow = high - low
Highlowfib = Highlow * 0.618
- Trade rule for checking bullish or bearish candle. Here we check if the previous candle was a bullish candle. We also use the False output of the block to automatically make the sell side if it’s not a bullish candle, and thus it’s a bearish candle.
- Formula to calculate the .618 fib level. There are 2 formula blocks. The true output formula block does:
Fib = High - Highlowfib
The false output formula block does:
Fib = Low + Highlowfib
- Pending order blocks. The last step is placing the buy and sell pending order blocks. The orders are opened at Custom price level Fib. And the stop loss is placed at Candle low of Candle ID 1 for a buy, and at Candle high of Candle ID 1 for a sell. The take profit for both is 500% of stop loss.
Get Access to the Fibonacci Retracement Template
Want to see how this Fibonacci Retracement Strategy works when fully automated?
Access an enhanced automation template used to turn this trading concept into a deployable MQ5 trading bot inside Profectus. This template has a trade execution module included, so you can start testing it right away!
Disclaimer: Templates are for educational purposes only!
👉 Get the Fibonacci Retracement Automation Template → Fibonacci Retracement Profectus Template
This template is designed to run on the Daily Timeframe
How to run the Strategy in Metatrader 5?
We have written a full article to get you started in Metatrader 5 and how you can run any automated strategy, such as the Inside Bar strategy, as an Expert Advisor yourself.
Read the full guide here to run your first trading bot in MT5
Other related blog posts
Dive into a world of knowledge, trends, and industry updates on the Variable blog. Our curated content covers a spectrum of topics.