Building & Testing New York Breakouts
How to create and test the New York Breakout Strategy and read the prop firm analysis report
Test Before You Trade
One of the most expensive ways to test a trading strategy is to pay for a prop firm challenge, start trading it, and only then discover that the system was not suited to the challenge rules. In this article, we are looking at the New York Breakout strategy, a straightforward long-only system tested on USD/JPY on the 1-hour timeframe.
The strategy looks for a quiet previous trading day, marked by a Doji candle. On the current day, it measures the range established during the London Session and anticipates a breakout of the range to the upside. The actual trading only happens during the first 3 hours of th New York session, when the volume is the highest.
Disclaimer: Templates are for educational purposes only!
👉 Get the New York Breakout Strategy Template → Template Link
This template is designed to run on the1-hour timeframe.
You might also want to watch the full YouTube video on this strategy here to get the full explanation of the strategy.
Using a Doji and the London Range
The idea is simple: when the market spends a day moving sideways, the first breakout can offer a clean trading opportunity. We use yesterday’s candle (Candle ID 1 on the Daily timeframe) to establish this sideways move. If this candle is a Doji candle, we can confirm it was a sideways, indecisive day. The exact rules of a Doji for us are simple. Yesterday’s daily candle body must be no larger than 50% of its total high-to-low range.
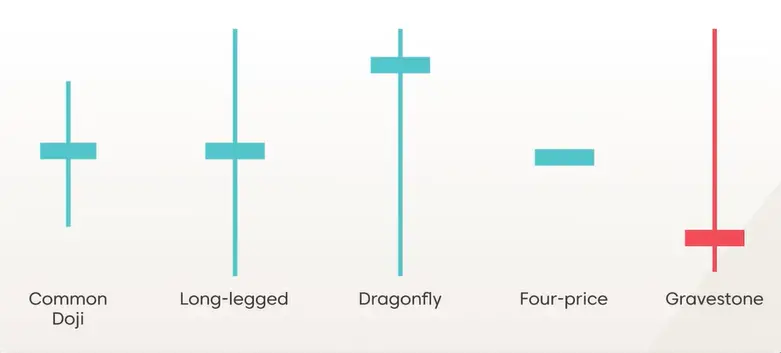
The second part of the strategy is the London Range. At New York open, the system looks back 10 hours and stores the highest and lowest price over that 10-hour period. These are now our range high and range low.
The New York Breakout Strategy
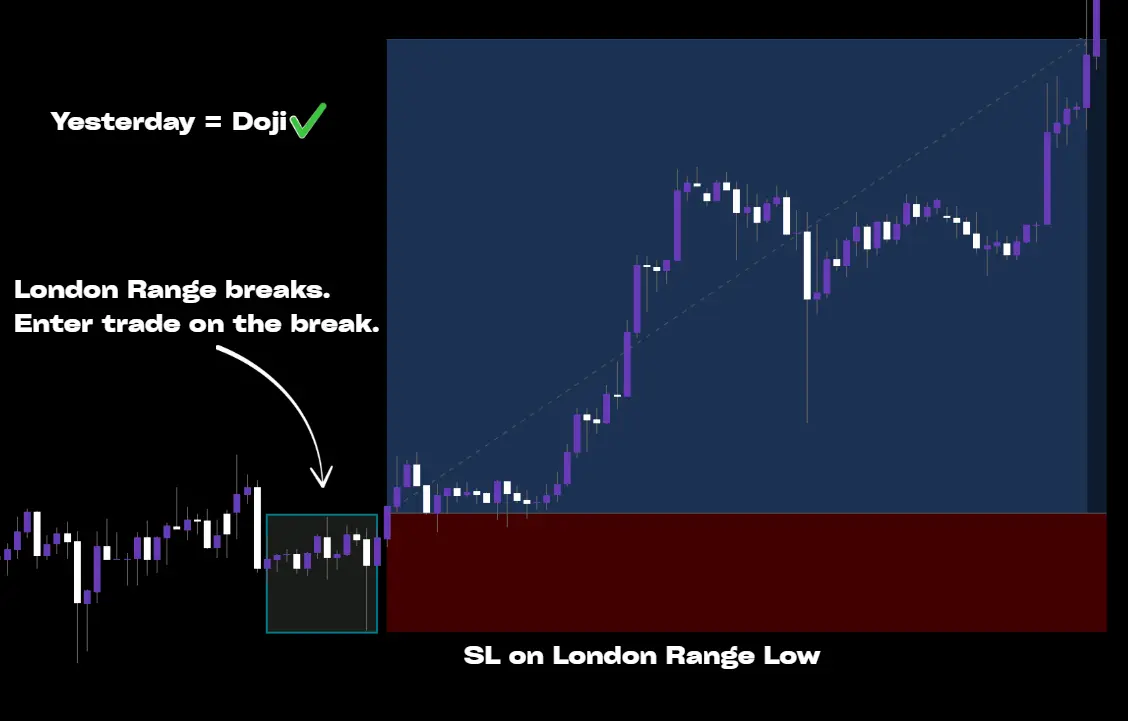
Let’s go through the exact strategy rules step-by-step:
- On USD/JPY, use the 1-hour timeframe. At 15:30, save the highest high and lowest low of the previous ten hours as the London range.
- Calculate the stop-loss distance as the London range high minus the London range low.
- Check if the previous day formed a Doji candle
- Check if no trades have been taken this day
- Between 15:31 and 18:00 take a buy trade if price crosses the London Range High, ONLY if there is no High Impact news within the next 15 minutes
- Open the buy trade with a stop-loss equal to the size of the London Range, and a take profit at 4R
- When a trade reaches 1R of floating profit, move the stoploss to breakeven.
It’s a very straightforward but powerful trading plan. Let’s build it together in Profectus next.
Building the New York Breakout Strategy in Profectus AI
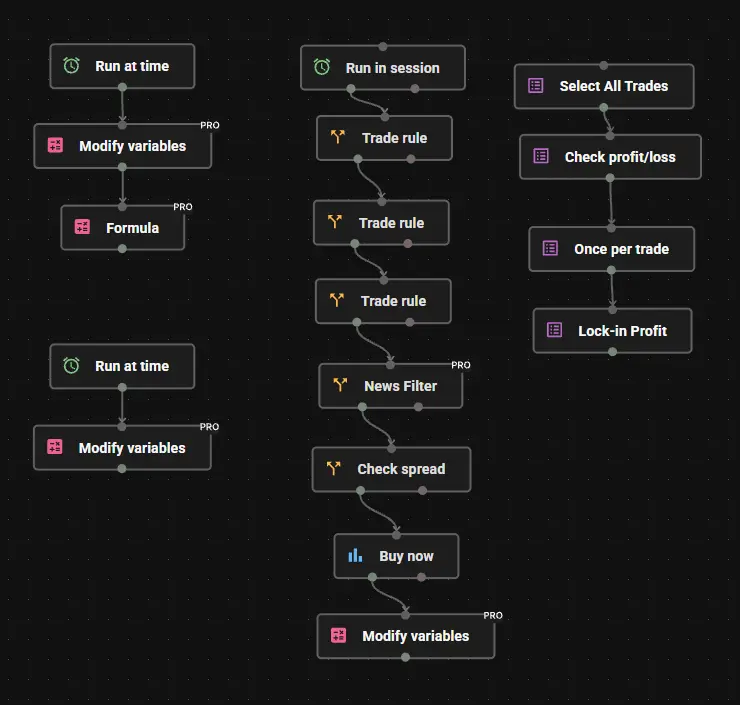
- Initiate the Variables. There are 4 main variables needed for this system. Create the following variables with default values of 0:
Range_High
Range_Low
Range_Size
Buy_Today - Measure the London Range. Start with a Run at Time block and set the time to 15:30. Connect a Modify Variables block to save the high and low of the 10-hour lookback on the 1-hour timeframe.
Range_High = Market Property, Highest Price (H1, 10-hour lookback)
Range_Low = Market Property, Lowest Price (H1, 10-hour lookback)
- Calculate the range-based stop loss. Connect a Formula block to the Modify Variables block and calculate:
Range_Size = (Range_High - Range_Low) - Set the breakout session. In a new decision tree, start with a Run in Session block and set the entry window to:
15:31-18:00 - Check yesterday’s doji candle. Connect a Trade Rule block. Under Advanced Options, use the Daily timeframe and Candle ID 1. Check:
Candle Body Size (D1, ID 1) <= Total Candle Size (D1, ID 1) * 0.5 - Check for no previous buys today. Connect another Trade Rule block and put:
Buy_Today = 0 - Check for the London range breakout. Connect another Trade Rule block and check whether the current price crosses above the saved high:
Current Market Price x> above Range_High - Add the News Filter. Connect a News Filter block to avoid opening a position around high-impact news. In the video, an example window of 15 minutes before and 15 minutes after the event is shown. Adjust this to your prop firm’s rules.
- Check the spread. Connect a Check Spread block and put:
Spread < 5 - Buy Now. Connect a Buy Now block. When all conditions are true, use the following settings:
Money Management = Risk % of Balance, 1%
Stop Loss = Fixed pips, using Range_Size as the range-based distance
Take Profit = 400% of Stop Loss (1:4 risk-to-reward)
Auto-Close Trade = Off - Mark the daily entry as completed. After the Buy Now block, connect a Modify Variables block and set:
Buy_Today = 1 - Reset the daily buy variable. In a separate tree, connect a Run at Time block at 01:00 to a Modify Variables block. Reset:
Buy_Today = 0 - Select the open buy trades. In a separate trade management tree, start with a Select All Trades block and select Open Trades, Buy positions.
- Check the floating profit. Connect a Check Profit/Loss block and require the selected trade to reach a floating profit of approximately 1% of the account balance.
Floating Profit (% of Balance) >= 1% - Apply the management only once per trade. Connect a Once Per Trade block so that the stop-loss adjustment is not repeated on every tick.
- Lock in profit around breakeven. Connect the Lock-in Profit block and set the value shown in the video:
Lock-in Profit = -1 (the example’s near-breakeven setting)
Backtesting the New York Breakout on USD/JPY
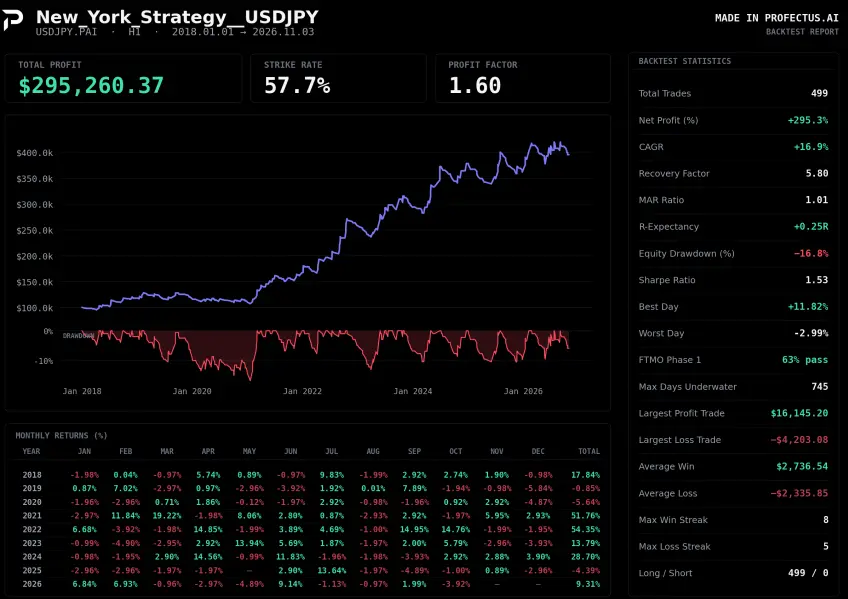
With the automation built, the next step is to run the strategy through a substantial historical sample. In Profectus AI, we can inspect each entry and exit on the chart, open the trade list, and review the full strategy report. That gives us a better picture than a winning trade screenshot alone, especially because a breakout system can have long periods when market conditions are not favorable.
A profit factor of 1.60 means the strategy generated 1.60 units of gross profit for each unit of gross loss in the historical test. That is useful, but it does not tell us how losses are distributed. The drawdown curve, monthly returns and time spent underwater matter just as much.
How to Read the Prop Firm Evaluation Results
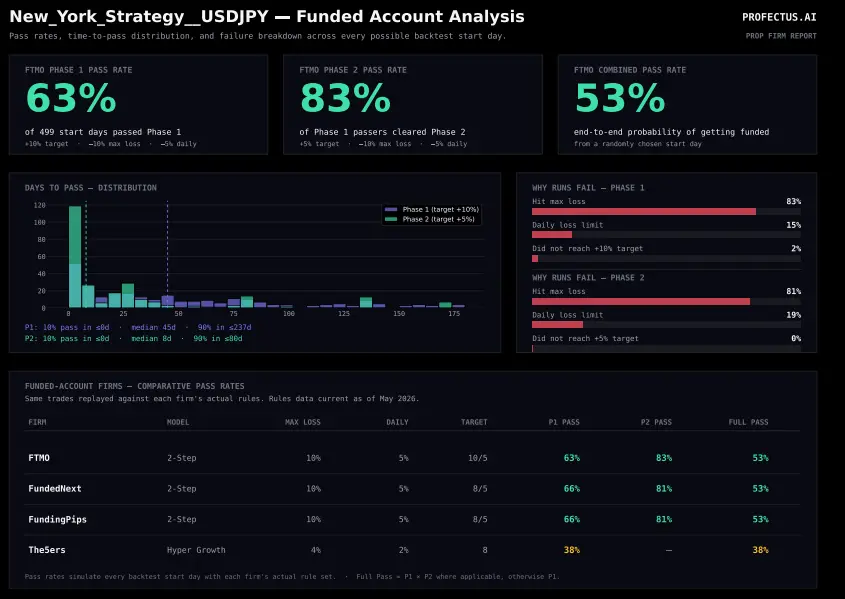
In this prop firm analysis section of the backtest report, the pass rate for phase 1 with the FTMO prop firm sits at 63%. Another interesting fact here is that this report shows a median phase 1 pass opportunity in 45 days. Combined passing of phase 1 & phase 2 sits at 53%.
Obviously, these are average statistics taken from this specific backtest run. In reality, some historical start dates would have cleared the challenge relatively quickly, while others would have taken much longer. That variation matters for a trader who pays challenge fees, faces minimum trading-day or consistency conditions, or has limited time to manage an evaluation. A pass rate should therefore be assessed together with expected time to pass, drawdown and possible challenge cost—not read as a guarantee that a future account has a 53% chance of success.
Why Small Rule Changes Can Change Prop Firm Results
Simply changing the range calculation time from 15:30 to 16:00, adjusting the opening window accordingly, or moving from a 1:4 to a 1:3 target can change both the strategy statistics and the simulated challenge pass rate. The idea for you to understand is that different test versions can produce different prop firm probabilities and results. That is why I would test adjustments systematically rather than optimizing only for the highest return. Try a small, sensible range of entry times, stop-loss multipliers and targets, then look at whether improvements persist across different market conditions and out-of-sample periods. A higher historical pass rate is only useful if it comes from a robust strategy rather than a setting chosen to fit the past perfectly. Want to explore the New York Breakout strategy yourself? Open the template link and backtest the strategy for yourself using our in-house backtester.
Disclaimer: Templates are for educational purposes only!
👉 Get the New York Breakout Strategy Template → Template Link
This template is designed to run on the1-hour timeframe.
Other related blog posts
Dive into a world of knowledge, trends, and industry updates on the Variable blog. Our curated content covers a spectrum of topics.