Automating Wilder’s Volatility Strategy
This Wilder Volatility Strategy is always in position. Let's build it together in Profectus AI
Automating a Classic Volatility System
Some of the most famous trading indicators were developed by the same person. J. Welles Wilder introduced tools such as the Relative Strength Index (RSI), Average True Range (ATR), and Average Directional Index (ADX). Even more interesting are the strategies that were created using these indicators.
In this article, we're going to recreate the Wilder-inspired volatility strategy in Profectus AI. It's a little different from the strategies we normally build: rather than entering a trade, setting a fixed stop loss, and waiting for a target, this system changes direction when price moves far enough against the current trend. That makes it an interesting exercise in automation and building in Profectus AI. However, because of the lack of a stop-loss, this strategy has a higher risk than usual. If you want some extra visual guidance, we recommend that you also watch the full YouTube video explaining the strategy.
Disclaimer: Templates are for educational purposes only!
👉 Get Wilder’s Volatility Strategy Template → Template Link
This example is designed around XAU/USD on the 4-hour timeframe.
How Wilder’s Volatility Strategy Works
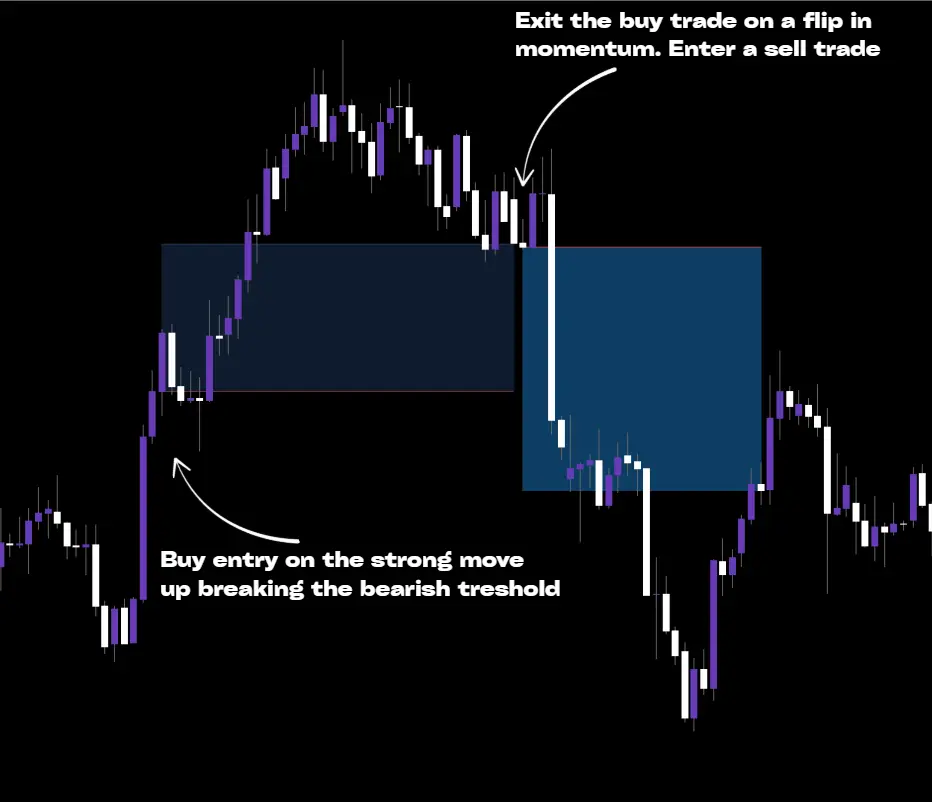
As the name suggests, this is a volatility breakout strategy that is always in position. It will always be long or short depending on where the momentum is pointing to. Wilder's Average True Range measures how far price has been moving over a series of candles. When volatility increases, the market tends to make bigger moves; when volatility decreases, those moves tend to be smaller. We can use the ATR to set a threshold for when a market move is significant. We can use this threshold to time when a move is slowing down and likely to reverse in opposite direction.
When the strategy holds a buy position, it keeps track of the highest closing price reached during that trade. From this level, it calculates the reversal threshold using the ATR multiplied by a constant, a distance called ARC.
As long as price stays above that threshold, the strategy stays long. However, if price closes below the threshold, the system interprets this as a potential trend reversal. It closes the buy position and opens a sell.
For sell positions, the logic works in reverse. The strategy tracks the lowest closing price and switches to a buy when the market closes above the threshold
This continuous switching between long and short positions is what makes Wilder's system different.
The chart illustrates the main idea: price can move strongly in one direction, reverse, and force the algorithm to switch sides.
Building Wilder's Volatility Strategy in Profectus AI
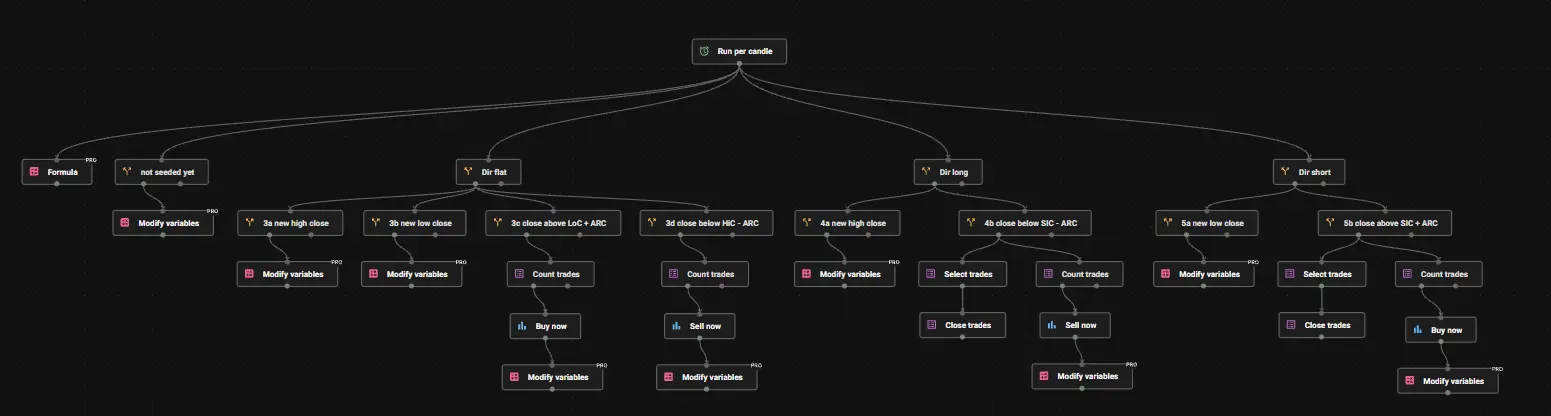
This is a pretty large strategy to build but that is mainly because of the buy and sell side alternating constantly. It becomes more manageable when we split it into three parts: the general rules, the buy-side, and the sell-side. Let’s build it together.
General Rules and First Trade
- Initiate the Variables. The strategy stores the current direction, its volatility distance and the key closing prices. Create the variables and put the default values to 0:
ARC
LoC
HiC
SiC
Direction - Start with a Run Per Candle block. The strategy runs on H4, so the logic continues each time a 4-hour candle closes.
- Calculate the ATR-based distance. Connect the Formula block to calculate the reversal distance from ATR. This value determines how far price must move before a new direction is considered:
ARC = ATR-based reversal distance (use the period and multiplier in the template) - Initialize the first reference prices. Connect the “not seeded yet” Trade Rule to a Modify Variables block. Store the starting closing-price references so the strategy can identify its first trade.
- Set the direction branches. Connect the three Trade Rule blocks named Dir flat, Dir long and Dir short. The strategy follows only the branch for its current position.
- Track new closes before the first entry. Under Dir flat, connect the “3a new high close” and “3b new low close” Trade Rule blocks to Modify Variables. These keep the reference closing prices up to date before a position is opened.
Buy-Side Trading Logic
- Check for the first buy entry. From Dir flat, connect the “3c close above LoC + ARC” Trade Rule block. A buy becomes valid when the last closed candle finishes far enough above the stored low close:
Candle Close (H4, ID 1) > LoC + ARC - Open the buy trade. Connect Count Trades to verify that no position is already open. Then connect Buy Now and Modify Variables to save the new Long direction and its reference prices. Use:
Open Trades = 0
Money Management = Fixed lot, 1.0 in the example
Stop Loss = None
Take Profit = None
Direction = Long
- Update the highest close while long. From Dir long, connect “4a new high close” to Modify Variables. If gold closes higher, store that updated closing-price reference for the reversal rule.
- Reverse from sell to buy. From Dir short, connect “5b close above SiC + ARC”. If the upward reversal is large enough, select and close the open sell trade. Check the trade count, open the new buy with Buy Now, and update the variables:
Candle Close (H4, ID 1) > SiC + ARC
Select Trades → Close Trades (sell position)
Count Trades → Buy Now → Modify Variables
Direction = Long
Sell-Side Trading Logic
- Check for the first sell entry. From Dir flat, connect “3d close below HiC - ARC”. If gold closes below the stored threshold, check that no trade is open, connect Sell Now, and save the Short direction:
Trade rule block: Candle Close (H4, ID 1) < HiC - ARC
Open Trades = 0
Sell Now = Fixed lot, 1.0 in the example
Stop Loss = None; Take Profit = None
Direction = Short - Update the lowest close while short. From Dir short, connect “5a new low close” to Modify Variables. When gold closes lower, store the new closing-price reference for the next reversal check.
- Reverse from buy to sell. From Dir long, connect “4b close below SiC - ARC”. When price falls far enough, select and close the existing buy trade. Then check the trade count, open Sell Now and update the direction:
Candle Close (H4, ID 1) < SiC - ARC
Select Trades → Close Trades (buy position)
Count Trades → Sell Now → Modify Variables
Direction = Short - Check the execution settings. Both sides use the same fixed position size in the video, with no fixed stop loss or target. Check the symbol’s contract specifications and the order in which the closing and opening blocks execute.
Backtesting Wilder’s Volatility Strategy on Gold
We ran this strategy on XAU/USD on the 4H chart from 2018 to 2026. It contains 408 trades, evenly split between 204 long and 204 short positions. The historical net return is +152.8%, with a 37.2% strike rate and a profit factor of 1.22. Those figures show that the system does not need a high win rate to be profitable. However, because of the lack of a stop-loss it’s very important to consider the risks of this system more carefully.
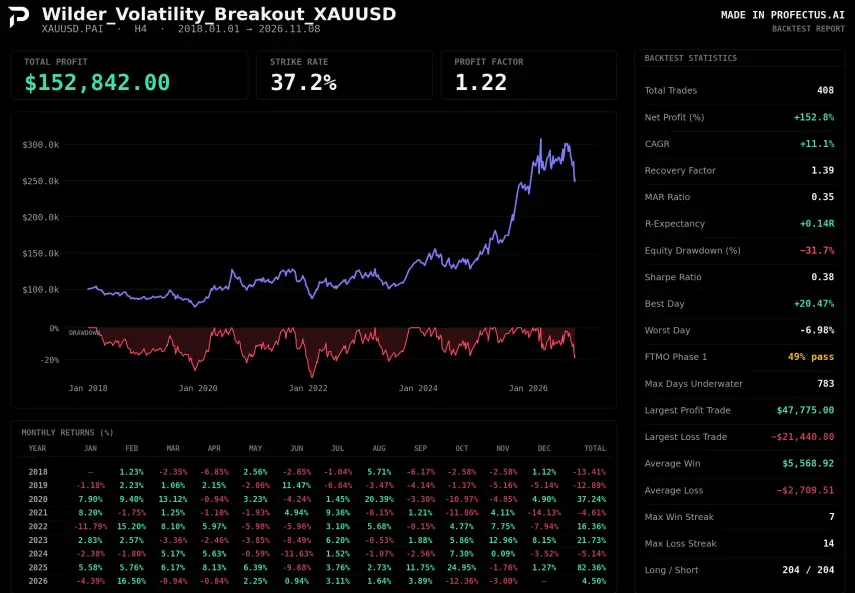
The report also shows a Sharpe ratio of 0.38, a MAR ratio of 0.35, and 783 maximum days underwater. In other words, the return was not particularly smooth, and there were extended periods of drawdown.
The advantage of Wilder's Volatility Strategy is that the signal distance can adjust to different market environments. That does not mean one set of settings will automatically work on different assets such as EUR/USD or the SP500 index. ATR behavior and volatility regimes differ between markets, and changing the ARC threshold can alter how often the strategy reverses.
The next useful experiment is therefore not to chase the highest historical return. It's to compare several sensible ARC settings on different assets. A strategy with a slightly lower return but better drawdown control might be more worthwhile to pursue.
Get Access to Wilder's Volatility Strategy
Explore the Profectus AI template to check Wilder's exact ATR settings and test the strategy on XAU/USD H4. Review the risk settings before running it in MetaTrader 5.
Disclaimer: Templates are for educational purposes only!
👉 Get Wilder’s Volatility Strategy Template → Template Link
This example is designed around XAU/USD on the 4-hour timeframe.
Other related blog posts
Dive into a world of knowledge, trends, and industry updates on the Variable blog. Our curated content covers a spectrum of topics.