Webinar: Supply & Demand EA in Action
Putting a unique Supply & Demand zone trading strategy to action in Profectus
.webp)
Automating S&D Demand Zones in Profectus
Once a month, we're hosting a webinar for Profectus members in which we share a strategy relating to that month's topic. In this February 2026 edition we're sharing a unique Supply & Demand Strategy created on Profectus.
In this blog I want to give a better insight into the idea and workings of the stratey. If you want to watch the recording of the complete live webinar, check it out here!
Let's get started!
Using the RSI to spot Demand Zones
Traditional Demand zones are drawn purely from price action — typically where price departed aggressively from a level.
RSI Demand zones introduce an additional dimension:
Sentiment and statistical exhaustion.
Instead of assuming a level is important because price moved away from it, the RSI Demand methodology asks:
Has the market pushed far enough in one direction to justify a reversal?
By requiring multiple closes below a predefined RSI threshold, the strategy identifies moments where:
- Selling pressure has been sustained
- Momentum may be weakening
- The market is vulnerable to a shift
This approach does not replace price action — it refines it.
Before you move on, you might want get a refresher from the introductory Supply & Demand Zone article here.
Using the lower timeframes for confirmation
The idea for this strategy was to create a multi-timeframe focussed automated trading bot for MT5.
While the RSI Demand zone identifies where demand entered, the strategy still requires a precise entry trigger.
This comes from a bullish engulfing candlestick pattern on a lower timeframe.
A valid bullish engulfing entry should:
- Fully engulf the prior bearish candle
- Display strong directional intent
- Show impulsive characteristics
The engulfing pattern confirms that buyers are actively defending the zone, not just slowing the decline.
Multi-Timeframe Execution: Swing Context, Tactical Entry
This strategy operates across timeframes:
Higher Timeframe
Defines the RSI Demand zone and swing context.
Lower Timeframe
Provides precise entries using bullish engulfing patterns.
This separation allows traders to:
- Avoid premature entries
- Reduce risk
- Improve timing
- Capture larger moves
Structurally, a Demand zone is identified by:
- 3 candles closing below the 40 RSI level
- A clear bullish impulsive move in 2 candles
- Identify the last imbalance candle before the impulsive move
These characteristics make this iteration of the Demand zone unique but also very mechanical to create and test.
How do we define an impulsive move?
To automate this Demand zone, you need mechanical rules for all of the elements. To identify a Bullish Impulsive move, we implemented the following rules in our Expert Advisor:
- Candle ID 1 needs to close as a bullish candle
- Candle ID 1 needs to close above the highs of Candle IDs 3,4, and 5
- Candle ID 2 needs to close as a bullish candle
The screenshot above shows the candle ID numbers to help you understand better what these rules actually look like.
Creating the Demand Zones Using Profectus AI
With Profectus, you can transform the Supply & Demand Zones concept into a fully automated module without writing code.
The creation of this trading bot can be split up in 3 sections:
- The Creation of the Demand zone
- The Demand zone retest and entry
- The Demand zone invalidation
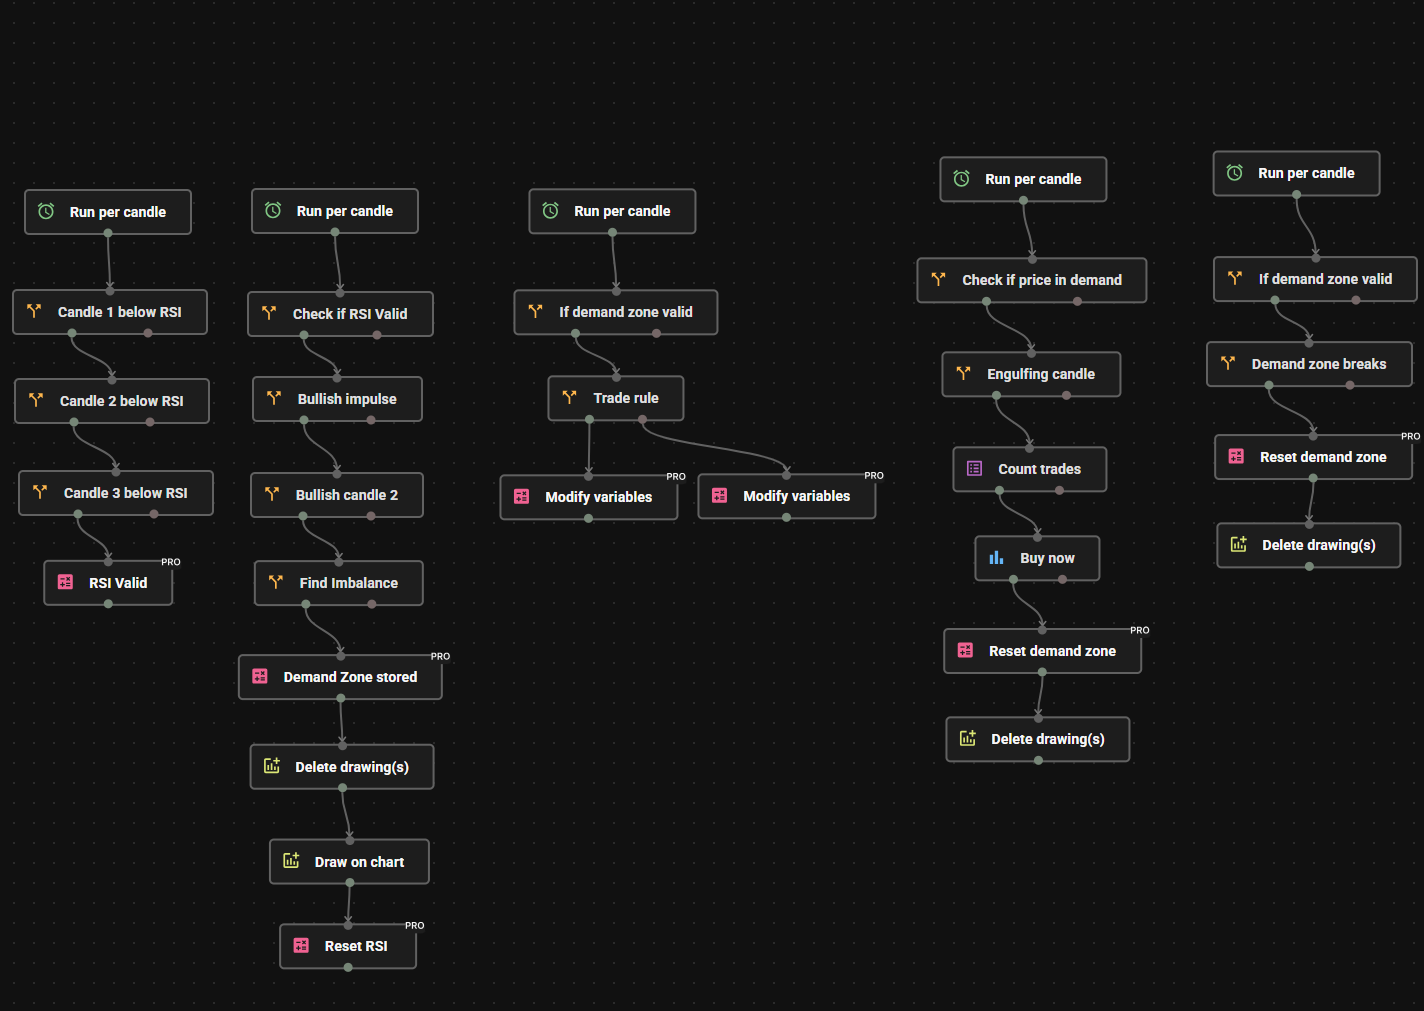
Step 1: Identifying the Demand zone
The foundation of the strategy is detecting when price has become overextended to the downside. However, An overextended market alone does not guarantee a reversal. Trends can persist longer than expected. Therefore, the next requirement is a clear shift in momentum.
To qualify as an RSI Demand environment:
- Three consecutive candles must close with RSI below 40
If the RSI move is confirmed, you can run the blocks to find the impulsive move and the imbalance candle to actually draw the Demand zone:
- Two consecutive bullish candle closes
- Bullish momentum confirmed with one candle closing above highest price of last 3 candles
- Look if there is an imbalance candle before the bullish candles
- Store the Demand zone high on the imbalance candle high, store the Demand zone low on the imbalance candle low
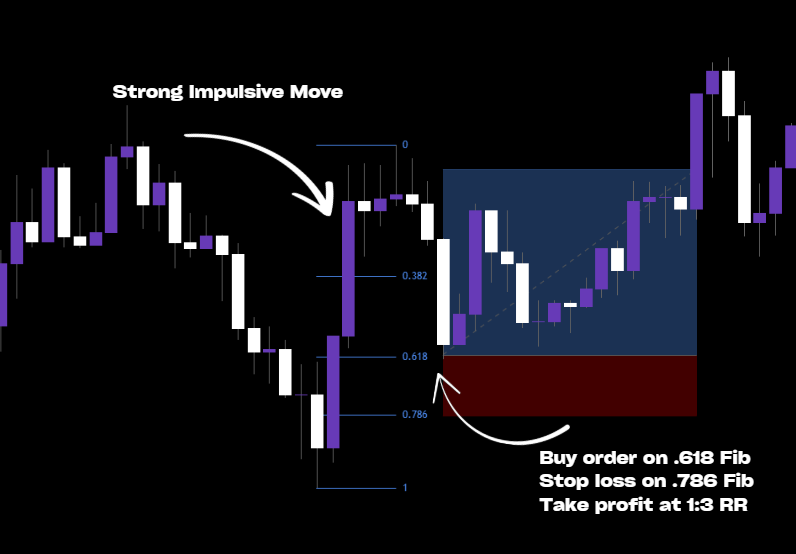
Step 2: Retest and entry from the Demand zone
Once the zone has been identified and stored, you wait for the low of any candlestick that follows to touch the demand zone high. While the RSI Demand zone identifies where demand entered, the strategy still requires a precise entry trigger.
This comes from a bullish engulfing candlestick pattern on a lower timeframe after the demand zone has been retested:
- Price has reached the Demand zone high
- A bullish engulfing candle on the lower timeframe (by choice) is the entry signal
Step 3: The Demand zone invalidation
If the price retested the demand zone, you want to start looking at the invalidation criteria to discard the zone. The criteria is:
- A candle close below the demand zone, invalidates and deletes the demand zone
After step 3, all the values are reset back to their default settings and your expert advisor can start looking for new fresh demand zones and repeat steps 1 to 3.
Final Thoughts
Markets do not reverse randomly. They transition.
By combining:
- RSI-based exhaustion detection
- Momentum confirmation
- Structural Demand zones
- Bullish engulfing entries
This strategy captures the moment when selling pressure fades and buying interest begins to dominate.
It is not designed to catch every reversal.
It is designed to identify high-quality transitions.
For swing traders seeking a structured, repeatable framework, RSI Demand zones with engulfing entries offer a compelling balance between statistical context and price-based execution.
Get Access to Demand Zone EA Templates
The template for the strategy that we just described in this article was exclusively shared with Profectus members who attended the live webinar.
However, we invite you to create this strategy on your own using the information from the webinar recording and this article.
You can also find a wide selection of pre-built strategies in our extensive and ever-growing Trading Bot Library here!
If you're interested in another detailed Supply & Demand zone article, check out the introductory Supply & Demand Zone article here.
Happy building!
Other related blog posts
Dive into a world of knowledge, trends, and industry updates on the Variable blog. Our curated content covers a spectrum of topics.
.png)