Trending Support & Resistance Strategy Automation Guide
Using Fractals & EMA to find reliable support & resistance levels in trending markets
Introduction: Making Support & Resistance Easy to Automate
At Profectus, we aim to make difficult trading concepts easy to understand for everyone, using automation. Although support & resistance might not sound like a difficult concept, the ambiguity of what defines a support & resistance level leads to confusion and analysis paralysis.
In Profectus AI, we take a more mechanical approach. Instead of manually marking zones on the chart, we define support and resistance through fixed formulas based on previous price data. This makes the process objective, repeatable, and fully automatable inside a strategy.
Using Fractals & EMA to define support & resistance
In this article, we will look at a simple way to do that by using fractal levels as objective structure points, while using an EMA to trade in the direction of the prevailing trend. This creates a cleaner framework where market structure and trend are both defined mechanically rather than emotionally.
Instead of looking at how many touches a level has had to be classified as support or resistance, we look at fresh levels that align with the trend. Looking at support & resistance from this perspective allows us to take trades with the trend when it’s still relevant. Historical levels are less relevant here.
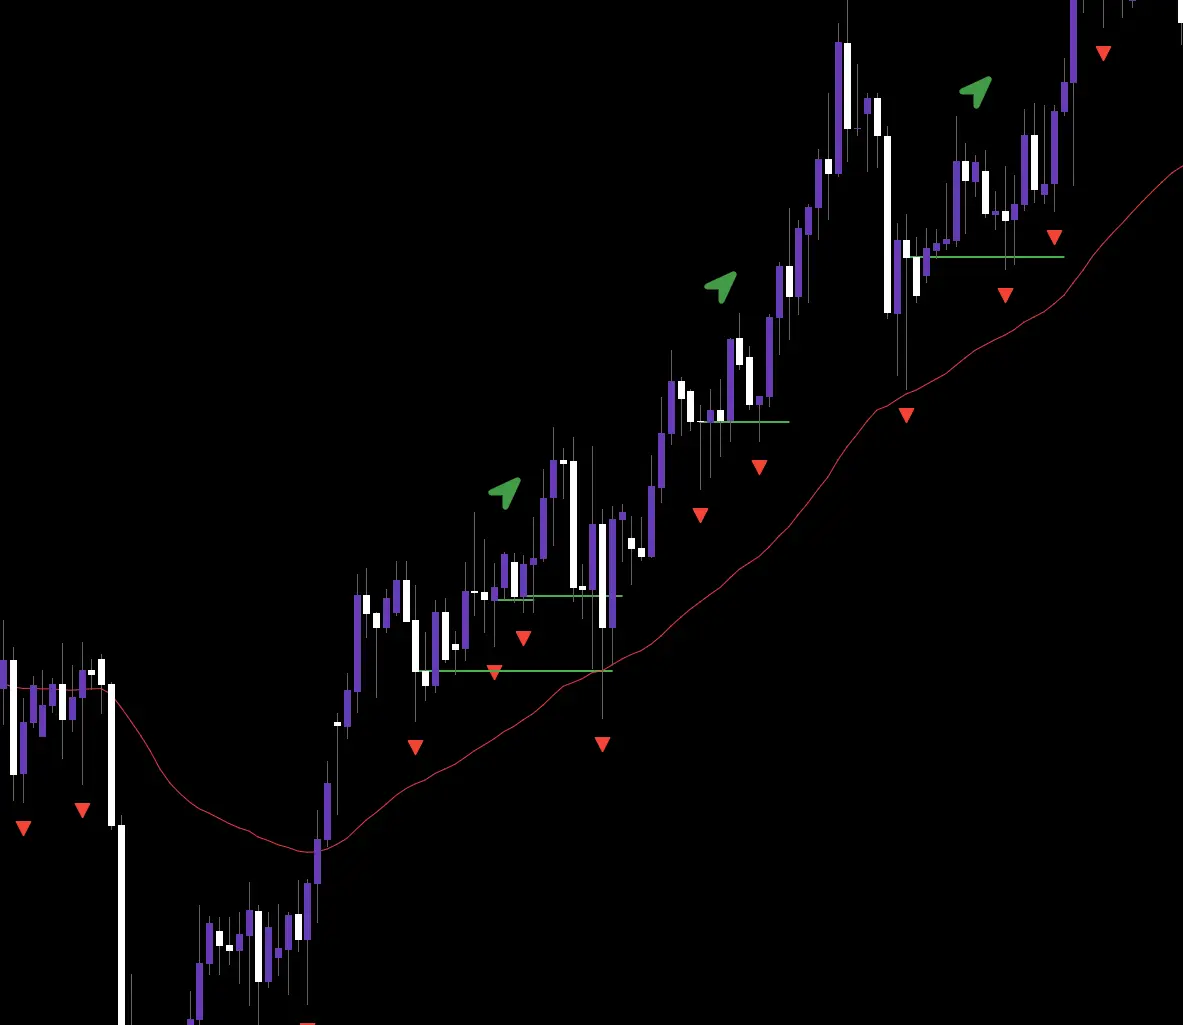
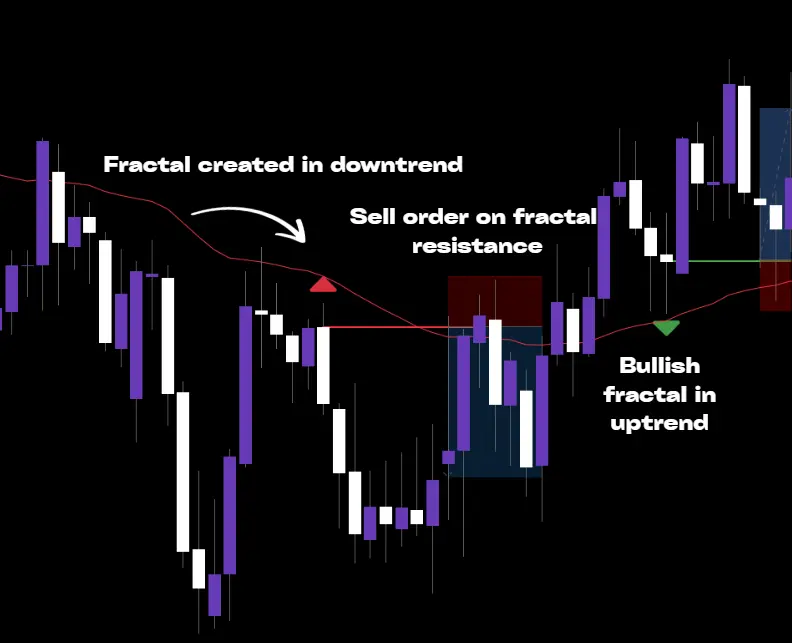
The chart example above shows the levels that this strategy is looking at. We are clearly looking at an uptrend, and in this strategy, we look to draw our levels from fractal low levels as long as they form in the direction of the trend. The green lines visualize the levels this strategy is finding and trading from.
Using fractals and the EMA to define trend and structure
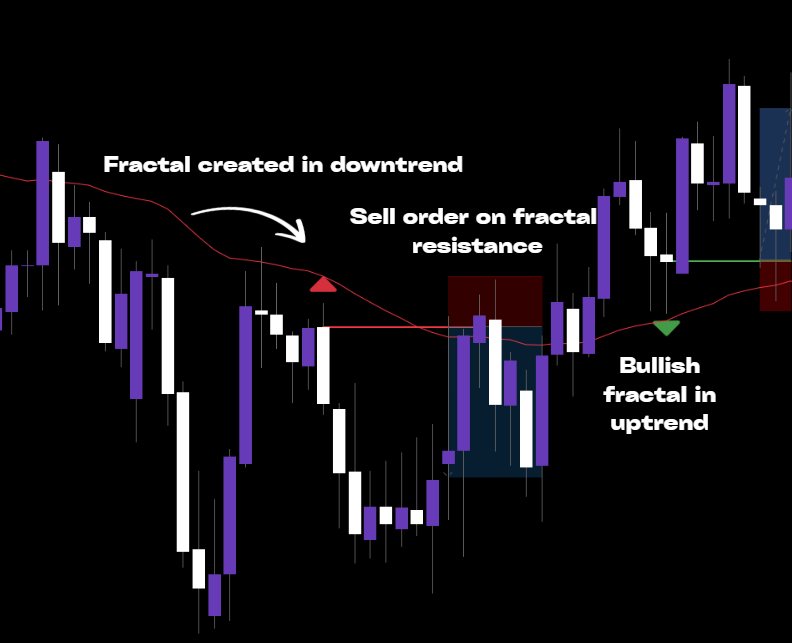
In this approach, the EMA is used to define the market direction, while fractals are used to mark the support and resistance levels we want to trade from. Together, they create a simple mechanical framework that tells us both where the trend is and where price is allowed to retrace into structure.
The trend filter is based on the 20-period EMA. As long as price continues to close above the 20 EMA, the market is considered to be in an uptrend. In that environment, the strategy is only interested in long opportunities. Rather than buying at random points during the move, the system waits for new support levels to form within that uptrend.
These support levels are built from 2-period fractals. Fractals are a candle combination which we are using throughout different strategies, get a better understanding of how to use Candle IDs to build such candle combinations. When a bullish fractal structure appears, the level is not drawn from the wick, but from the lowest body value of the candle formation that creates the fractal. That body level becomes the support line. If that support level forms above the 20 EMA, it qualifies as a valid long trading level. The strategy can then place a pending buy order on that support area, expecting that if price retraces, the level may act as support again within the trend.
This process continues as long as the market remains above the EMA. New qualifying fractal support levels can be added, and existing orders remain valid while the uptrend is intact. The EMA, therefore, acts as the directional filter, while the fractals provide the exact structural levels where orders are allowed.
Once the price closes below the 20 EMA, the trend condition changes. At that point, all outstanding buy orders are removed because the bullish structure is no longer valid under the rules of the strategy. The system then stops looking for long entries and begins preparing for the opposite scenario.
In a downtrend, the same logic is applied in reverse. If price is closing below the 20 EMA, the market is treated as bearish. The strategy then looks for resistance levels.
Disclaimer: Templates are for educational purposes only!
👉 Get the Trending Support & Resistance Automation Template → Trending Support & Resistance Profectus Template
Structurally, a fractal support level is defined as:
- Price is above the Daily 20-period EMA
- A 2-period fractal was formed above the Daily 20-period EMA
- The support level is drawn from the body low of the fractal candle
These characteristics make this iteration of support levels completely mechanical and allow for trading opportunities.
Automating the Trending Support & Resistance Strategy in Profectus AI
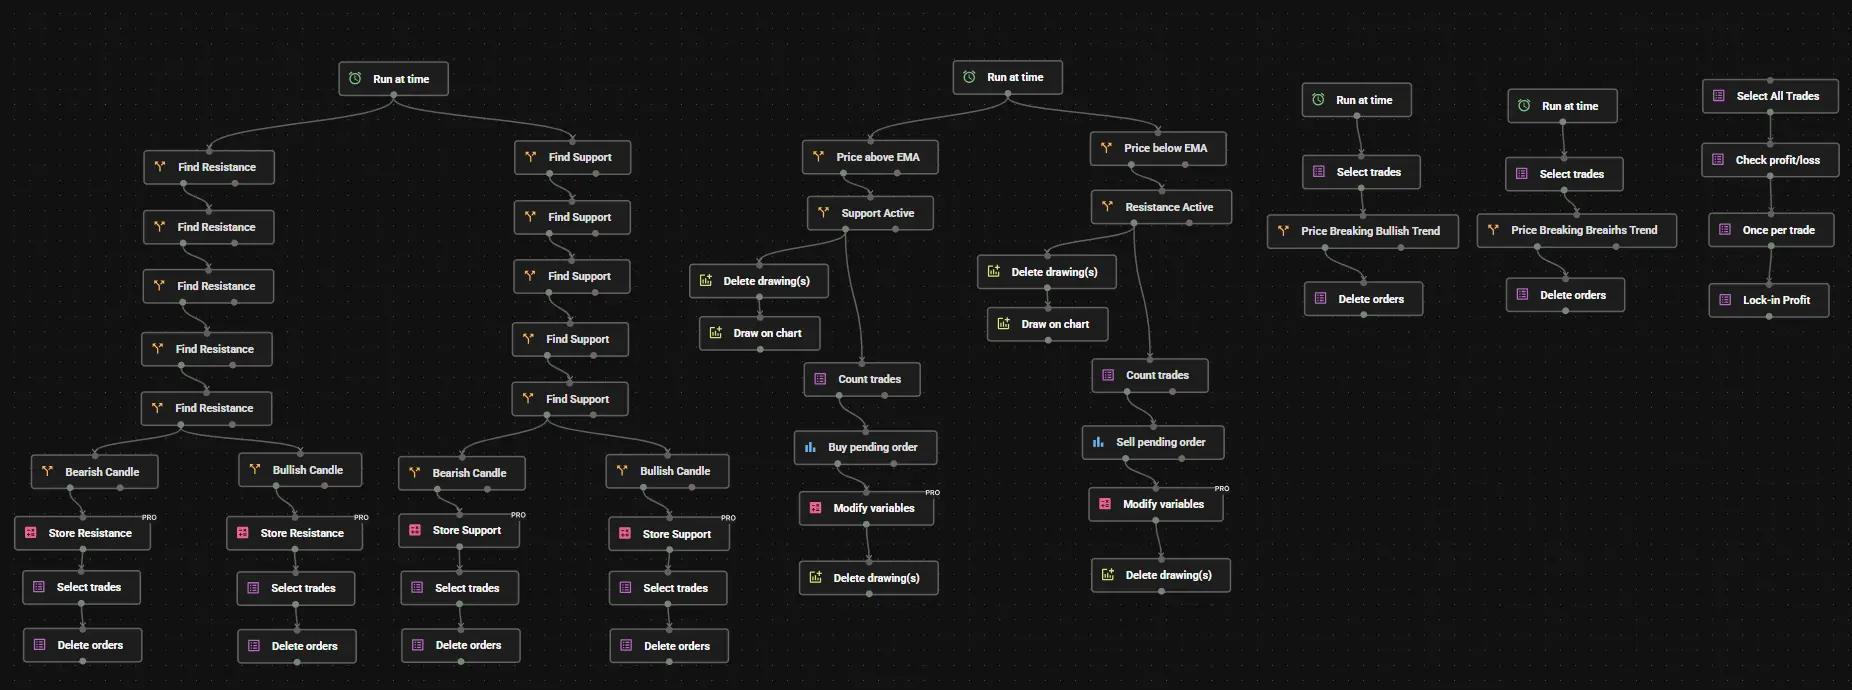
I named the blocks to make it easier for you to understand what we’re doing in each Profectus block. This concept is not difficult, but it’s a pretty big project, and I have already programmed the buy and sell side for this strategy. We can divide the creation of this no-code EA for the Trending Support & Resistance Strategy into 4 steps. To make it easier, let’s focus on the Support and buy-side only for now.
- Identify the fractal support levels. The first step is to find the fractal levels by finding the lowest price of a 5-candle combination. If the fractal has been identified, the support level is stored on the body low of the fractal candle. If a new level is found along the way, the old level and order will be deleted.
- Defining the trend and placing the order. This section houses all the rules to define a valid trade setup. Most importantly, the support level and current market price need to be above the 20-period EMA. If so, a buy limit order is placed on the support level.
- Trade invalidation. If price happens to break the 20-period Daily EMA we say that the uptrend has been broken and the EA will delete the open orders.
- Trade Management. The last section is the trade management section and we use the lock-in profit management template. This means that after a certain floating profit has been reached, the stoploss will be moved into positive territory to lock in a predefined amount.
And that’s it! It only takes a few minutes to drag-and-drop the blocks and build this Trending Support & Resistance Strategy in Profectus. You can now add more rules to refine the entries, or add more confluences to the strategy.
Deploying the Strategy as an MQ5 Bot on MetaTrader 5
Once automated, the Trending Support & Resistance strategy can be deployed as:
- An MQ5 trading bot
- Running 24/5 on MetaTrader 5
- Executing trades exactly as designed once you add buy/sell blocks and rules
Why MT5?
- Built-in algorithmic execution
- Broker compatibility
- Robust order handling
- Industry-standard platform for automated trading
This allows you to move from manual chart analysis to mechanical automated trading.
Can You Automate Other Support & Resistance Strategies?
Yes. In our blog library, this is the second of the Support & Resistance strategies, but more will follow. This is the Pivot & EMA Support Strategy.
We can automate any Support & Resistance strategy if it’s mechanical.
If a strategy has:
- Clear rules
- Defined conditions
- Objective execution logic
It can be automated.
Support & Resistance levels are just one example of how trading concepts translate perfectly into algorithmic systems.
Get Access to the Trending Support & Resistance Strategy Automation Template
Want to see how this Support & Resistance concept works when fully automated?
Access an enhanced automation template used to turn this trading concept into a deployable MQ5 trading bot inside Profectus. This template has a trade execution module included, so you can start testing it right away!
Disclaimer: Templates are for educational purposes only!
👉 Get the Trending Support & Resistance Automation Template → Trending Support & Resistance Profectus Template
Other related blog posts
Dive into a world of knowledge, trends, and industry updates on the Variable blog. Our curated content covers a spectrum of topics.