Pivot Points & EMA Support Strategy Automation Guide
Automating a Support & Resistance strategy using Pivot Points and EMAs in Profectus AI
.webp)
Introduction: Making Support & Resistance Easy to Automate
Every trader is familiar with the terms support & resistance. It’s the most basic concept of trading and fundamentally used in almost every strategy in many different varieties. However, it’s also the most ambiguous concept in trading. For manual traders, areas of support & resistance are mapped based on what the eye sees and how the individual perceives levels and zones. Give 10 manual traders the same blank price chart, ask them all to map out the support and resistance levels. You will end up with 10 completely different charts with levels plotted in different areas.
In Profectus AI, we take a more mechanical approach. Instead of manually marking zones on the chart, we define support and resistance through fixed formulas based on previous price data. This makes the process objective, repeatable, and fully automatable inside a strategy.
Using Pivot Points & EMAs as Support & Resistance
For this strategy we will be using the Pivot Points indicator and the Exponential Moving Average (EMA) indicator to find our support & resistance levels. These indicators are based on fixed mathematical formulas meaning that the methods for finding the levels are always the same. There is no room for discretion.
Pivot Points are price levels derived from the previous candle’s High, Low, and Close. They are often used as reference levels to identify potential support, resistance, and possible breakout zones. We use the Pivot Point formulas to derive 3 levels based on the previous Daily candle.
- Resistance. The highest of the levels
- Pivot Point. The middle level that we actively use as support
- Support. The lowest level that we use to place our stop loss
You can build the Pivot Points indicator in Profectus AI with 1 Formula block and 4 variables:
- Pivotpoint
- Resistance
- Support
- Highlow
Next, we are going to build the formulas in one formula block.
The formulas we are using are:
Pivotpoint = (Previous High + Previous Low + Previous Close) / 3
Highlow = Previous High - Previous Low
Support = (2 × Pivotpoint) - Previous High
Resistance = (2 × Pivotpoint) - Previous Low
The formula starts with the variables as we defined them earlier. Make sure to apply them in this order in the formula block. In this article we are only focussing on the buy-side of the strategy and that means a focus on support levels.
Disclaimer: Templates are for educational purposes only!
👉 Get the Pivot EMA Support Automation Template → Pivot EMA Support Profectus Template
This template is designed to run on the 1H timeframe.
How do we combine Pivot Points & EMAs
In this strategy, Pivot Points and EMAs are not used as separate indicators. They work together to create a mechanical support and resistance framework that Profectus can evaluate objectively.
Pivot Points give us fixed horizontal price levels based on previous market data. These levels help define where support and resistance are likely to exist. The EMA adds a dynamic layer, showing where short-term trend support is currently forming. By combining both, we avoid relying on a single level and instead build a structured price environment around the trade.
Structurally, a Pivot & EMA support level is defined as:
- 50-period EMA is above the Pivot Point on the 1H timeframe
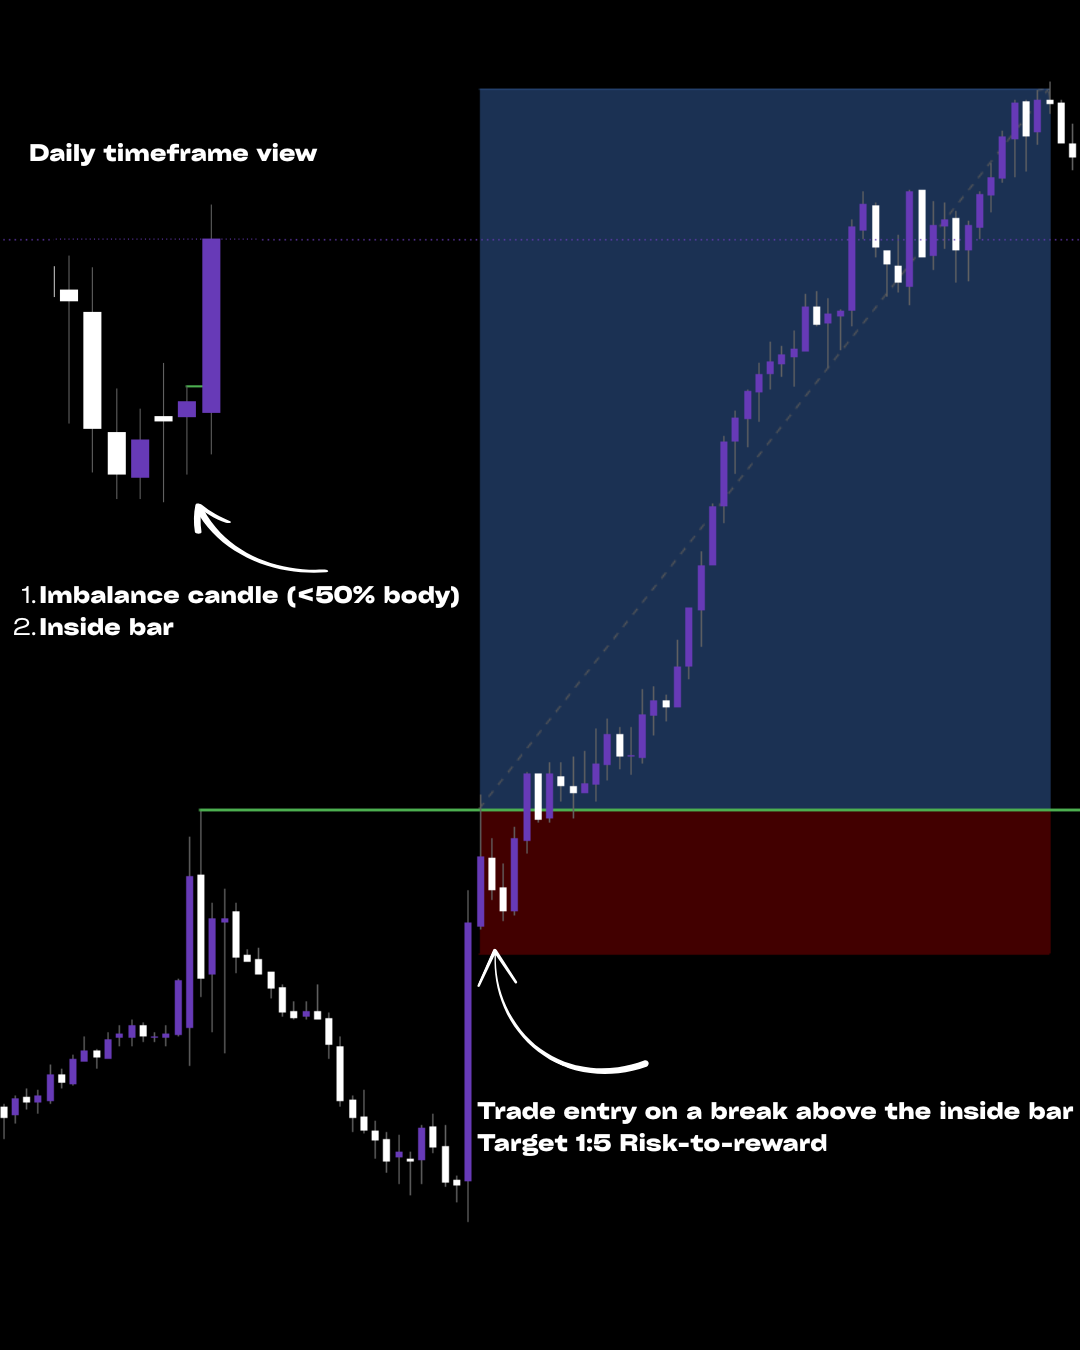
- Price just broke above the 50-period EMA on the 1H timeframe
- Price is below the 18-period EMA on the Daily timeframe
These characteristics make this iteration of support levels completely mechanical and allow for trading opportunities.
Automating the Pivot & EMA Support Strategy Using Profectus AI
For a long setup, the strategy first looks for price to break above the 50-period EMA. That breakout on its own is not enough. Price must also be trading above the Pivot Point, and the 50 EMA itself must also be above the Pivot Point. When these conditions align, the Pivot Point acts as one layer of support and the EMA acts as another. This creates a stronger, rule-based support structure below price.
Resistance is handled just as mechanically. The strategy checks whether there is enough room between the entry area and the Daily 18-period EMA. This prevents taking trades directly into a higher timeframe resistance level and helps filter out setups with limited upside.
From there, the trade management remains fully systematic. The Support pivot level provides a logical stop-loss location, while the Daily 18 EMA acts as the exit trigger when price crosses back through it. In this way, both entry and trade management are built around clearly defined support and resistance levels that can be automated inside Profectus without subjective chart marking.
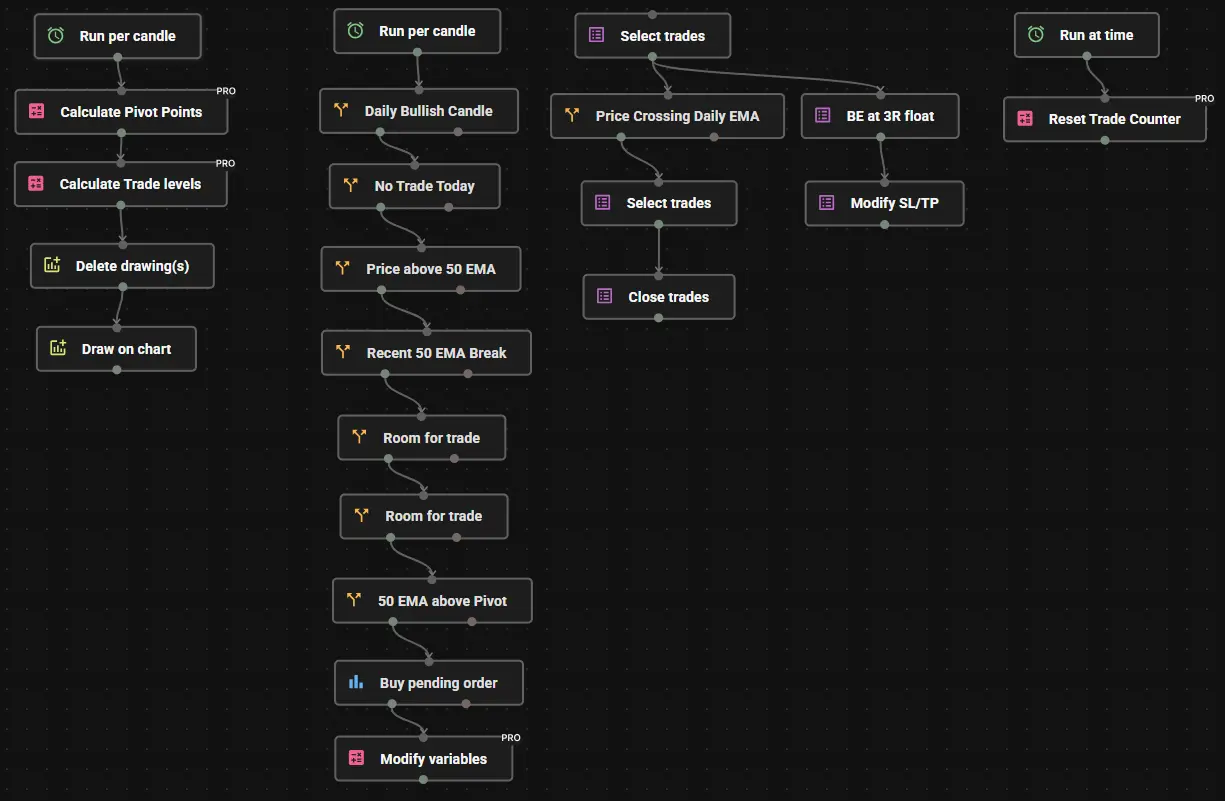
I named the blocks to make it easier for you to understand what we’re doing in each Profectus block. This concept is not difficult but it’s a pretty big project. We can divide the creation of this no-code EA for Pivot EMA Support Strategy into 4 steps.
- Identify Pivot Points & Trade levels. Using the Run per candle block, we first calculate the Pivot Points using the formulas as described earlier. We then calculate if the trade levels are valid. Finally, we draw the Pivot Points on the chart for visual aid.
- Defining a bullish trade setup from Pivot support. This section houses all the rules to define a valid trade setup. Most important is the break above the EMA, the distance between the Pivot and the target, and the placing of the buy pending order on the 50 EMA if all trade rules are satisfied.
- Trade management. If a trade is taken, the trade is managed through 2 simple rules. First, if price crosses the Daily 18-period EMA the trade is closed immediately. If the trade is floating 3R profit, and the Daily 18-period EMA has not yet been crossed, the stop loss is moved to breakeven for a risk-free trade.
- Reset variables. The last section is about resetting all values and variables at the end of each trading day so the system can start looking at new trade setups the next day.
And that’s it! It only takes a few minutes to drag-and-drop the blocks and build this Pivot EMA Support Strategy in Profectus. You can now add more rules to refine the entries, or add more confluences to the strategy.
Deploying the Strategy as an MQ5 Bot on MetaTrader 5
Once automated, the Pivot EMA Support strategy can be deployed as:
- An MQ5 trading bot
- Running 24/5 on MetaTrader 5
- Executing trades exactly as designed once you add buy/sell blocks and rules
Why MT5?
- Built-in algorithmic execution
- Broker compatibility
- Robust order handling
- Industry-standard platform for automated trading
This allows you to move from manual chart analysis to mechanical automated trading.
Can You Automate Other Support & Resistance Strategies?
Yes. In our blog library, this is the first of the Support & Resistance strategies, but more will follow. We can automate any Support & Resistance strategy if it’s mechanical.
If a strategy has:
- Clear rules
- Defined conditions
- Objective execution logic
It can be automated.
Support & Resistance levels are just one example of how trading concepts translate perfectly into algorithmic systems.
Get Access to the Pivot EMA Support Strategy Automation Template
Want to see how this Support & Resistance concept works when fully automated?
Access an enhanced automation template used to turn this trading concept into a deployable MQ5 trading bot inside Profectus. This template has a trade execution module included, so you can start testing it right away!
Disclaimer: Templates are for educational purposes only!
👉 Get the Pivot EMA Support Automation Template → Pivot EMA Support Profectus Template
This template is designed to run on the 1H timeframe.
Other related blog posts
Dive into a world of knowledge, trends, and industry updates on the Variable blog. Our curated content covers a spectrum of topics.