How to Build & Analyze a Portfolio
Learn how to move from analyzing single trading strategies to building a complete automated trading portfolio.
How to Build & Analyze a Portfolio
When we started trading, more than 10 years ago, we would focus on one strategy and would stick to it. The reason for this is simple: you can only focus on so much at a time, and trading one manual strategy perfectly is hard enough already.
One of the reasons for making the switch to automated trading was to reach perfect execution of our strategy, even while we were asleep. Naturally, this opens the door to trading multiple strategies at the same time, and soon we discovered the power of trading a portfolio of strategies.
That is where trading becomes a lot more interesting. One strategy can be analyzed on its own. You can decide whether you like the performance, whether the drawdown is acceptable, and whether the system fits your trading style. But once you start combining multiple systems, you are no longer only analyzing individual strategies. You are analyzing how those strategies behave together.
👉 Analyze your own MetaTrader 5 backtests with the Profectus Analyzer → Analyzer
When we launched the Profectus Analyzer, we also published an article about how to evaluate strategy backtest reports using the Analyzer. The article you’re about to read is the follow-up and focuses on building portfolios of strategies.
You can also watch the full YouTube video about Portfolio Building here.
Why Portfolio Thinking Matters
Again, one of the biggest advantages of automated trading is that you can trade around the clock with multiple strategies. Even when you’re at work, asleep, or just not at your desk.
But this also adds a new layer of complexity. Once you have more than one strategy running, the question is no longer only whether an additional strategy is profitable. The question becomes whether that strategy adds value to the full portfolio.
A strategy can look amazing on its own, but when added to a portfolio of strategies, it might not add much value and maybe even increase the overall risk. Alternatively, a single strategy can look average, but when added to a portfolio, it might increase overall profitability and decrease drawdown.
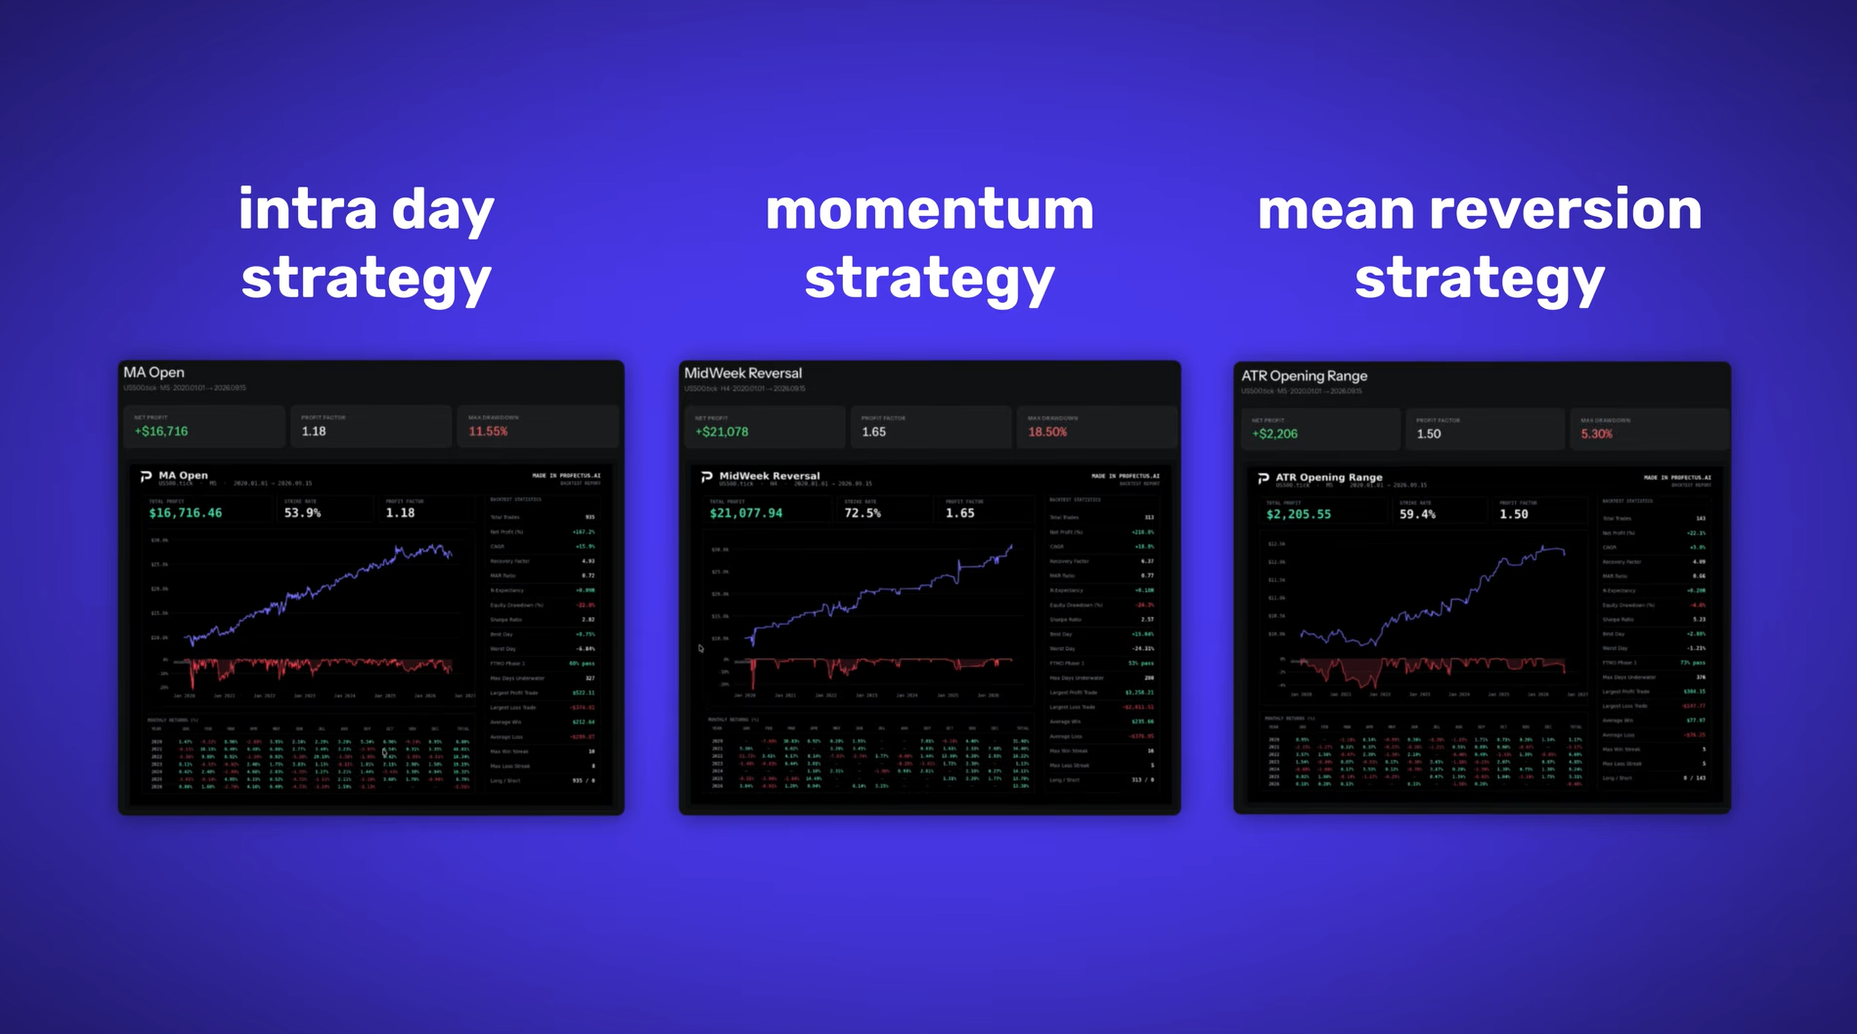
That is the real point of portfolio building. It is not just about adding more systems and hoping for more profit. It is about understanding whether the combination creates a better result than the individual parts.
Risk comes first
When traders look at a portfolio report, they often look at the return first. That makes sense. Returns are exciting and obviously a key feature of a successful portfolio. But what I actually want to look at first is the drawdown.
Drawdown shows how much risk there is in this portfolio. It tells you how much the portfolio declined during its worst period and how painful it would have been to keep trading through that period. A strategy can make a lot of money over the full backtest, but if it has a drawdown that you would never survive emotionally or financially, the return becomes worthless.
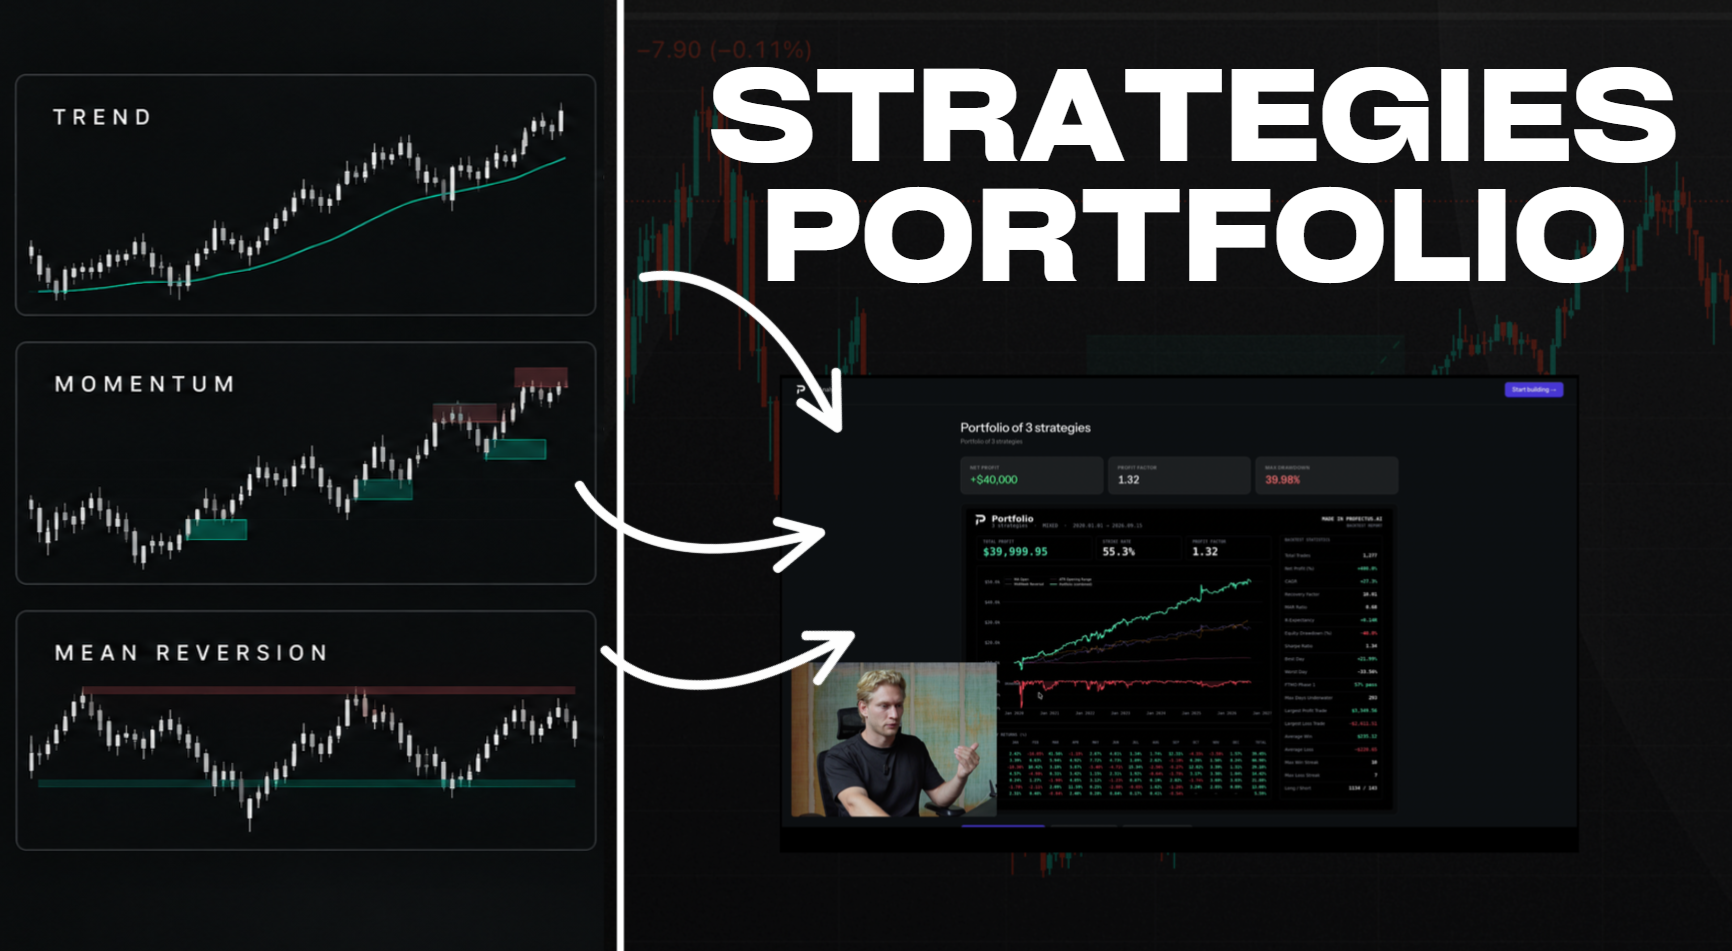
In the example from the video, combining the three strategies increases the return massively, but the drawdown also increases. That is the trade-off you always need to understand. More strategies can create more opportunity, but if the strategies are exposed to the same type of market risk, they can also create more concentrated drawdown.
The question now becomes: are the additional returns outweighing the additional drawdown?
It is also important to look at when the drawdown happened. If you are analyzing S&P 500 strategies and the maximum drawdown happened during the COVID crash, that gives you context. It tells you that the portfolio struggled during a major market shock, especially if the strategies were long-biased or did not use strict stop-loss logic.
That does not automatically mean the portfolio is bad. It means you need to understand the risk.
- Did the deepest drawdown occur in one extreme period?
- How quickly was the drawdown recovered?
- Are all of the strategies vulnerable to the same extreme market conditions? Or are some of the strategies capable of protecting the portfolio when others struggle?
Those are the questions that matter.
Position Sizing Can Change the Whole Report
Another thing that is often overlooked when building a portfolio is position sizing.
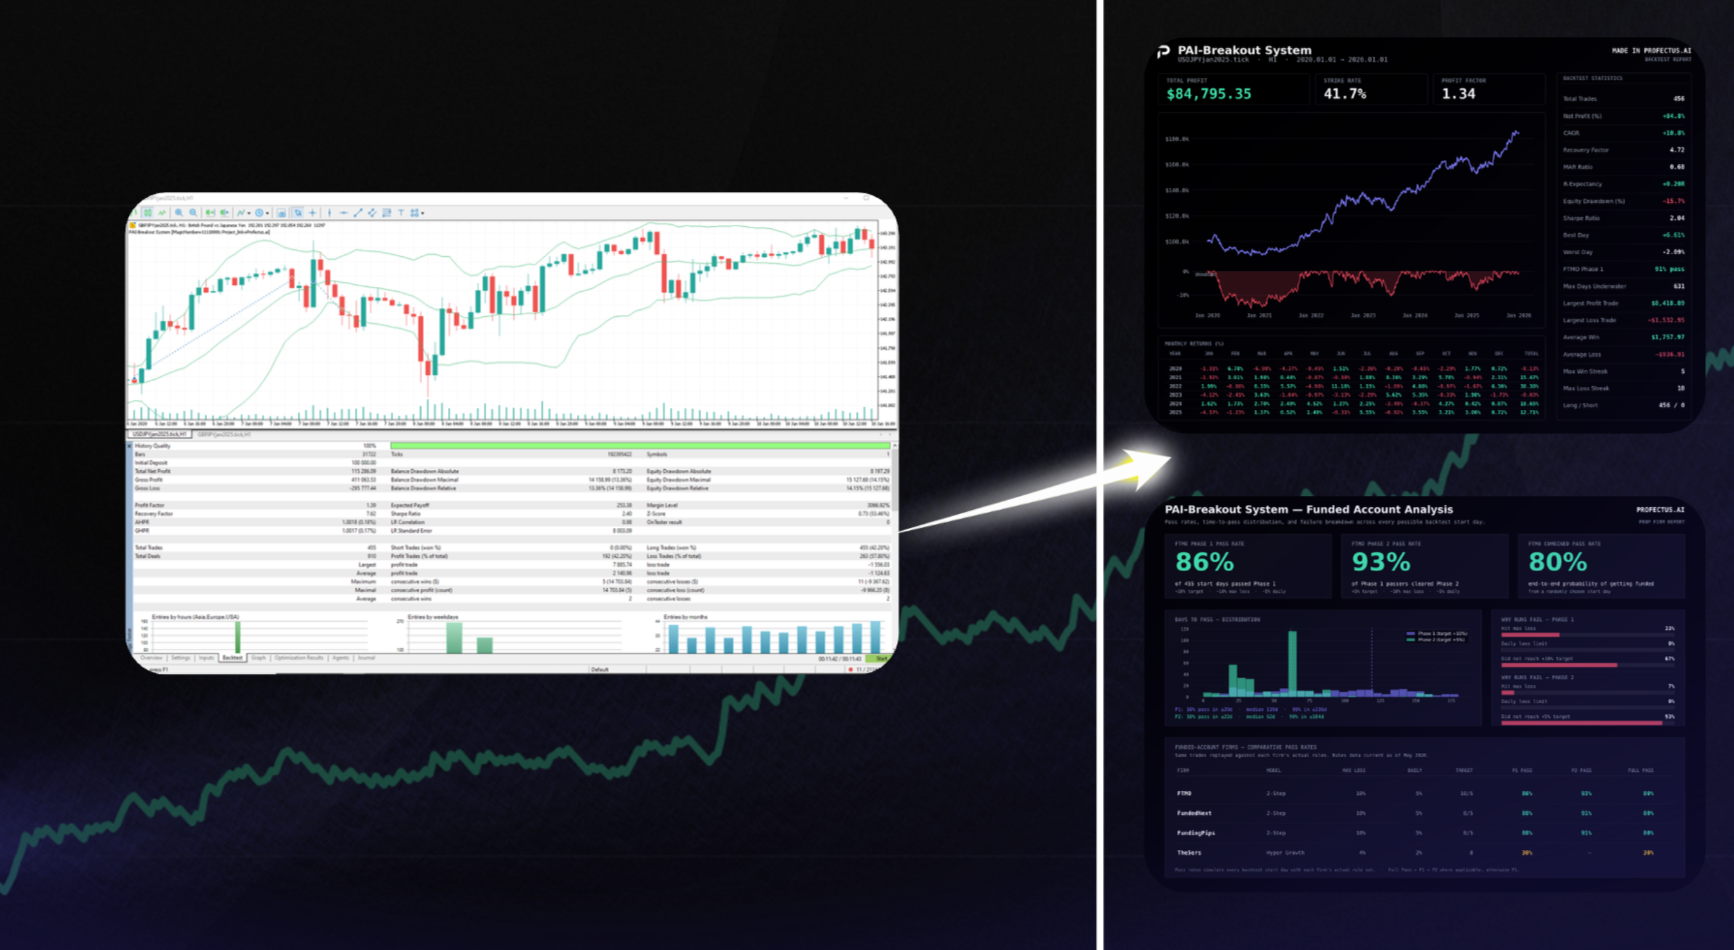
A backtest with a fixed lot size behaves very differently from a backtest that risks a fixed percentage of the account per trade. If a strategy starts with a 10k account and always trades the same fixed volume, the risk is highest at the beginning. As the account grows, that same position size becomes smaller relative to the account balance.
As a result, the drawdown may become smaller over time, but not necessarily because the strategy became safer. It may simply be because the lot size stayed the same while the account grew. This gives you a false image about the distribution of returns and overall risk and profitability.
Personally, I prefer thinking in percentage risk per trade, because the position size grows and shrinks with the account. If you risk 1%, 0.5%, or 0.1% per trade, the risk stays proportional.
Sample Size and Market Conditions Matter
A portfolio is only as useful as the data behind it. We put a big emphasis on sample size expressed in number of trades. This means that a backtest is only statistically significant if it has a large number of trades. Obviously, this is a vague description, but it comes down to rational thinking. A backtest report with 30 trades over a period of 5 years is not statistically significant and should not be considered. However, a backtest report with 30 trades over a period of 1 year can be considered significant.
If you backtest a strategy for a few weeks or only analyze a handful of trades, you do not know enough. A small sample can look good by luck. A few winners can create a beautiful equity curve, but that does not tell you how the system behaves during a crash, a sideways market, a high-volatility period, or a slow trending environment.
This is especially important for stock index strategies. The S&P 500 has a long-term bullish tendency, but it does not move higher in a straight line. Crashes happen. Corrections happen. Sideways periods happen. If your entire portfolio only takes buy trades on stock indexes, you need to know what happens when the market moves down aggressively. You do not want to discover that only after going live.
That is why I prefer to see a few hundred trades, or preferably more, over a long period of time (5+ years). In a period of 5+ years, you are likely to include all sorts of market behavior in your tests. You want to know how each strategy behaves during these different periods.
A breakout strategy may perform well when the market is trending. A mean-reversion strategy may perform better when price moves in a range. Just remember, no single strategy performs well across all market conditions. That is exactly why building a portfolio of strategies is so powerful. You are trying to combine systems that each have their own moment to perform.
The Goal is a Balanced Portfolio
Adding more strategies does not automatically mean building a better portfolio. Please remember this. If you add 5 long-only strategies on USDJPY or the S&P 500 together, that will likely not do much in terms of added value per strategy. Portfolio building is about creating diversification.
A better portfolio combines strategies that add something different. One system may perform well during strong trends. Another may do better when the market pulls back. This same logic applies to adding exposure to different assets. There is nothing wrong with only trading one asset at a time, but just know that adding more strategies on this same asset will likely not do much for your portfolio.
Sometimes a strategy with the highest return is not the best addition. If it also increases drawdown heavily, it may make the portfolio harder to trade. On the other hand, a strategy with modest returns may be very useful if it smooths the equity curve and performs during periods where the other systems struggle.
This is where metrics like Sharpe ratio, MAR ratio, profit factor, return-to-drawdown, and recovery factor become useful. They force you to look beyond profit alone.
A strong portfolio is not simply the one with the highest return. It is the one that gives you the best balance between return, drawdown, consistency, and recoverability.
Using Profectus Analyzer for Portfolio Analysis
This is exactly where the Profectus Analyzer becomes useful.
Instead of only looking at one backtest report in isolation, you can upload your MetaTrader 5 backtest files and analyze the results in a much clearer way. You can review the equity curve, drawdown curve, monthly returns, trade list, win rate, profit factor, MAR ratio, and other key statistics. More importantly, you can start comparing strategies against each other and see how they behave as part of a larger portfolio.
That changes the way you think.
The Profectus Analyzer is a free tool built as an add-on to Profectus AI. You can upload your backtest reports, inspect the individual strategy results, compare performance, and start making better decisions about which systems belong together. The goal is not just to create more algorithms. The goal is to build better portfolios, faster.
👉 Analyze your own MetaTrader 5 backtests with the Profectus Analyzer → Analyzer
Becoming a Portfolio Manager
Building a trading portfolio is one of the biggest advantages of automated trading. You can build multiple systems, test them individually, and then analyze how they work together. But that also means you need to think differently. A portfolio is not better just because it has more strategies. It is better when the strategies complement each other.
That means you need to understand the concept of risk-to-reward and drawdown. You also need to know how your systems behave in different market conditions. And you need to know whether each strategy actually improves the full portfolio.
That is the real work.
The goal is to build a collection of strategies that work together and create a more stable result than any single strategy could create on its own.
Other related blog posts
Dive into a world of knowledge, trends, and industry updates on the Variable blog. Our curated content covers a spectrum of topics.